DM Wenceslao is an integrated property developer in Philippines listing on PSE this Friday. Learn more about the IPO before investing.
Read More
DM Wenceslao is an integrated property developer in Philippines listing on PSE this Friday. Learn more about the IPO before investing.
China’s largest used car e-commerce platform, Uxin, is listing today on NASDAQ.
Xiaomi Corporation will likely be listed July 9, 2018. Here is what you need to know before investing.
Huifu Payment will be publicly listed on June 15. Here is what you need to know before investing.

Written by Toh Zhen Zhou
IPO & Placements Specialist, Smartkarma
Read more of Zhen Zhou’s work by clicking here!
The announcement of Spotify’s direct listing on NYSE on the 3rd of January 2018 has sent Wall Street into a flurry of mixed emotions around the possible success of such a trend setting move. In a world where decentralisation is being embraced, cryptocurrencies are being discussed in high schools and the continued advancements of technologies driving digitally disruptive companies, will this be the start of a long and drawn out headache for investment banks and brokers, as unlisted companies choose to list directly on the world’s stock exchanges?
It’s clear that small and mid-cap companies have no chance of entertaining such a daring move, however, this could shape the way IPOs are held in the future, especially for successful, popular and well-known private companies that are not cash hungry, but interested in broadening their scope of opportunities. What affects this will have on all IPOs is yet to be known, but it’s clear that 2018 is set to be the year that IPOs took a turn, better or for worse, we will soon find out.
The biggest question of all, will Uber and Airbnb follow? With their rumoured IPOs expected in 2018 or 2019, they may well hold to see how Spotify as the first mover plays out.
Listing on the stock exchange via an IPO has been a long and drawn out process that has many moving parts, from financial reporting to legal documentation to industry outlook reports. Investment banks have typically played a critical and controlled part in the chain, including planning and more importantly, selling the shares to investors. Although, it’s common knowledge that this process has a number of drawbacks for the unlisted company and is not the most efficient.
Essentially, the direct listing by Spotify cuts out the underwriter and leaves the price discovery solely in the hands of the market, rather than relying on institutional investors and brokers. Spotify’s decision to circumvent these standard processes has opened a new IPO method that is transparent and efficient.
Process of an IPO and the problems associated with them:
Additionally, there is the constant struggle between the three parties: the company, the investment bank, and institutional investors. The trilemma can be split into sell-side pushing for the highest valuation to earn more commission, the institutional investors trying to buy shares at the cheapest possible price, while the company trying to dilute its shares as little as possible.
The bottom line, this process is expensive, convoluted, and does not always see a direct alignment of the interests of the company, sell-side, and institutional investors. If the company carries most of this burden is debatable, but what if there was a better way.
The traditional IPO process is by no means obsolete. However, like most industries in the age of disruption, there are many processes in an IPO that can and should be improved.
Shortening the lead time (pre and post-IPO)
Reducing significant cost
No dilution while stock can be its currency
The NYSE recently made an announcement that it has changed certain regulations with respect to a direct listing.
Attracting more well-known, cash-rich private companies to list
More independent research and demand for corporate access
Spotify’s IPO will likely have a strong and positive impact on the US IPO landscape going forward. It will pave the way for future well-known private companies which are not cash hungry to list through this process and this will change the way investors and research is being conducted on IPOs. The democratization of information through a live stream of investor pitch is the kind of change that improves transparency for analysts and investors. It levels the playing field for independent researchers specifically.
Written by Toh Zhen Zhou
IPO & Placements Specialist, Smartkarma
Read more of Zhen Zhou’s work by clicking here!

Written by Mark Artherton
Senior Content Strategist, Smartkarma
Read more of Mark’s work by clicking here!
What is your coverage? This question gets asked a lot about investment research. It’s a quick and easy way to figure out the resources that a supplier of research wields. If JP Morgan covers 5,345 stocks and Merrill Lynch covers 6,254 stocks it appears that Merrill has greater resources and would be mining more sources for investment ideas (for clarity these coverage numbers are not the real numbers). This measure becomes more convincing when comparing to a second tier broker. If the second tier broker only covers 3,267 stocks, then clearly JP Morgan and Merrill Lynch have a depth advantage. The two larger firms employ many more analysts and would be able to answer questions on a wider variety of topics from their clients. In theory, they should also be able to unearth many more high-quality investment ideas as they constantly monitor large swathes of the market.
The concept of coverage gives the large investment banks another strong advantage when large global asset managers are looking to source external investment research. As a ‘one stop shop’ they are unparalleled. They can afford to subsidise analysts in favoured sectors and can easily win any arguments about depth of research. This advantage and a number of others factors mean that the large investment banks can be comfortable in generating a lot of revenue from their research departments even in the post MIFID II world. MIFID II is a deeply flawed piece of legislation when it comes to the promotion of independent investment research at the expense of investment banks. MIFID II does help provide some additional clarity on costs, but it fails to dent many of the significant advantages large investment banks hold.
If coverage was the only useful metric of depth and quality, then there would be no complaints about the big investment banks, and certain volume publishers would have cornered the market in investment research. The problem with coverage is that it does not help answer the quality question and is only one of a number of questions that should be asked about depth of research.
When investors consider research quality, the large investment banks trade on their brand and whilst they employ many very smart analysts, the brand may not be a guarantee of uniform quality. The volume research publishing houses have a much more difficult time with branding – especially when selling to professional fund managers. This quality deficiency may just be perceived or founded in fact, but it clearly hampers their ability to attract professional investors as clients. The value of their brand is yet another factor that helps the investment banks retain their entrenched position in the investment research marketplace.
Thankfully, there are some very successful independent research brands that are thriving. These houses offer a high-quality service in niche areas, but no independent provider has been able to truly reach the global scale of the large investment banks. The fact that there are no independent research houses offering global depth shows that the business model is not sustainable or, as is my opinion, there were other barriers working to discourage expansion – not least of which is the phenomenal costs involved.
Figure 1 – Quality or luck?

When investors consider an external research provision, post MIFID II, they are looking for value for money, depth and quality of analysis. Some specialised smaller investors will continue to favour niche external investment research providers but it is becoming more difficult to meet the requirements of the larger asset managers. Asking about coverage can help with understanding depth, but there is still no effective third party quality metric. Therefore, the individual portfolio manager has to make their own assessment of quality using their experience and judgement. Additionally, we believe that investors should frame their questions about depth in different ways now that new providers have entered the market.
The new investment research platforms, aggregated or collaborative network, can offer depth and high quality in a different way. Depth is not solely achieved by an army of analysts covering 10 to 15 stocks each. Depth can be achieved in different ways. One way is to act like a supermarket and stack the shelves with as much (perceived) depth as possible – the Walmart aggregated approach. Maybe even offer cheap ‘own label’ research. Coverage but blandness.
A better approach, in my opinion, is to consider the nature of information and build a solution that improves productivity. For example, there is a difference between accumulated knowledge (not inside knowledge) and the opportunity of knowledge. Accumulated knowledge does not have to sit with the individual. Accumulated knowledge can become embedded in a platform. Google is trying its best to make all knowledge available using its search tool but there is a long way to go before the knowledge that is required for an investment is easily codified by Google. Therefore, a platform that acts as a walled garden of investment knowledge can be of immense use for investment professionals and research providers alike.
The opportunity of knowledge means the ability to identify where something interesting is occurring or about to occur and filter that opportunity from the immense amount of noise in the system. This does not require legions of analysts, just individuals who know where and how to look for opportunity in the noise. The collaboration and combination of accumulated knowledge and individuals who know where to look for ideas in the noise mean that roaming analysts can cover more and more, and be more and more productive. These new approaches to investment research not only provide the depth the investor requires but can provide a boost to the global productivity of investment research.
It is rather like running a market that offers seasonal produce from local suppliers. The market stocks fewer goods but you can guarantee that you will leave with something tasty that you have probably not tried before, and if you keep going back the variety and sustainability will be more than a Walmart could offer. Depth without coverage.
Quality is another factor where new entrants have a clean slate and can offer innovative solutions. Basing the understanding of quality around the matrix in figure 1 is a start. In future posts, I will discuss the issue of quality in more detail and offer up some potential solutions.
So, the next time an investor asks about coverage, we should all steer the discussion towards depth. Coverage may be a way towards depth but it is also definitely a route towards blandness. Depth does not necessarily require coverage, it can be achieved in new ways that vary the investor’s diet and always surprise.
Written by Mark Artherton
Senior Content Strategist, Smartkarma
Read more of Mark’s work by clicking here!
 Has Passive Investing Peaked?
Written by Warren Yeh
Head of US, Smartkarma
The first book I ever read on investing was Burton Malkiel’s “A Random Walk Down Wall Street”, originally published in 1973 and considered by many to be the Bible of passive investing. By the time I read it in the early 80’s, Professor Malkiel was Dean at the Yale School of Management and a board member of the Vanguard Funds.
It left such an impression that I put my next paycheck into the Vanguard 500 Index Fund. Shockingly, despite my bold investment, index funds (deemed “un-American” due to their defeatist “can’t beat’em join’em” attitude) remained a tiny fraction of total assets in the years that followed. In fact, by the end of 1990’s – almost 30 years later – actively managed funds still accounted for roughly 90% of funds under management.
However, since 2000, the growth of passive management (index funds and ETFs) in the US has accelerated dramatically. In particular, over the last 10 years, passive management has not only gained market share but has clearly done so at the expense of active management.
![]()
Source: “Tracking US Asset Flows”, Morningstar
Much of this growth can be attributed to ETFs with the introduction of the SPDR S&P 500 ETF Trust (SPY). Celebrating its 25th birthday this year, SPY is now just one of nearly 7200 ETFs worldwide according to London-based research firm ETFGI. ETFs now account for 10% of US equity ownership and 36% of daily trading volume.
As a result of these funds flows, actively managed US equity funds are now 60% of assets while passively managed funds account for nearly 40%.
ETF ($bn) | Index ($bn) | Total Passive ($bn) | Active ($bn) | Total Assets ($bn) | % Passive | |
1999 | 31.20 | 334.90 | 366.10 | 2,632.60 | 2998.70 | 12.2% |
2016 | 1,329.40 | 1,805.60 | 3,135.00 | 5,044.10 | 8,179.10 | 38.3% |
Source: Itzhak Ben-David, Francesco Franzoni, Rabih Moussawi, “Exchange Traded Funds (ETFs)”. Annual Review of Financial Economics, Vol. 9, 2017
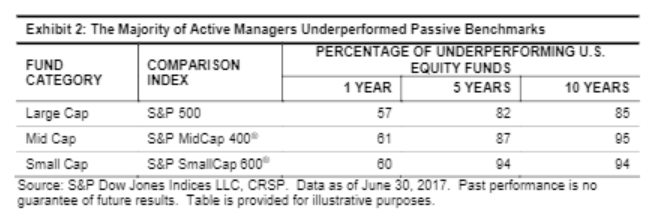
The simple reason for the move to passive investment is the combination of high fees and lousy performance. In the midst of this current bull rally, active managers have underperformed a highly resilient index. According to the recent S&P Dow Jones SPIVA Scorecard, over 80% of all active managers underperformed on a net basis over the last 10 years across almost all categories.
A factor that may have contributed to the underperformance of active managers was the increasingly crowded and overcompensated playing field. The proliferation of hedge funds since 2000 and massive compensation schemes attracted many players into the asset management world.
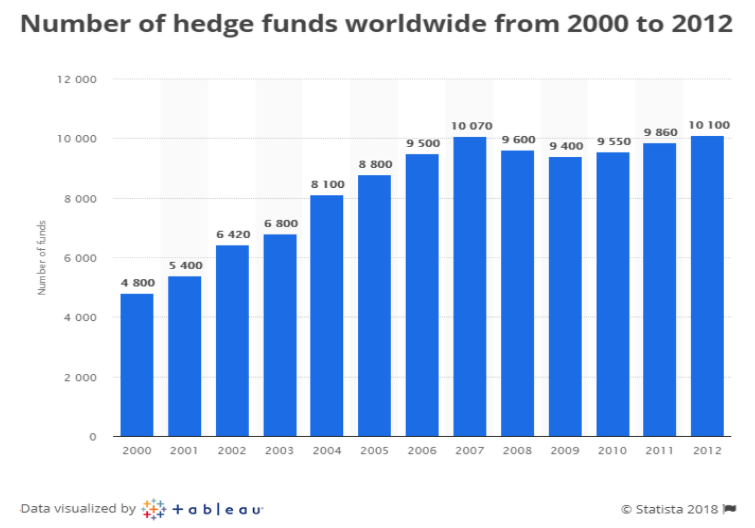
Source: Statista
I don’t think it’s a freak accident that the peaking in the number of hedge funds in 2007 coincides with the beginning of accelerated growth in passive assets.
While assets managed by hedge funds are still small relative to total actively-managed assets, the fees generated reached headline levels that often drew strong criticism and painted many active managers with the same brush. Any active manager’s underperformance became a magnified liability. Public funds had no choice but to allocate to passive strategies for far lower fee levels.
If passive investing is a good thing, then we are now getting too much of it. Here are some of the problems.
Every stock in the particular index is treated the same way.
For every dollar that is invested in a passive fund, the tracked index members get the same pro rata allocation of that dollar (usually by market capitalization) regardless of the underlying company quality. This means that correlation among index members is high and dispersion is low. As such, the worst companies will follow the best companies in a bull market and vice versa when sentiment reverses. If these features of correlation and dispersion are maintained over extended time periods then quantitative algorithms will model this tendency as the norm further exacerbating the issue.
Some companies are found in multiple indices and thus represented across multiple ETFs. According to Bloomberg, Apple (AAPL) can be found in 198 different indices. This can range from 1.3% of the Bloomberg World Index to 69% of the NASDAQ US Large Cap Growth Index. As money pours into a variety of ETFs for a variety of different reasons, AAPL shares will be bought across many different categories. Is it a surprise then that AAPL’s largest owners are Vanguard, Blackrock, and State Street? After all these three institutions account for 83% of the US ETF market and 70% globally. Look across any S&P 500 stock and three of the top five owners will be index funds.
Passive funds own a lot of stock but do not vote actively.
Proxy voting data from 2016 show that index funds vote with management 97% of the time. That shouldn’t be surprising. Low fees at these funds do not typically support an active proxy war. But it also means that issues like executive compensation, stock buybacks, and other practices condoned by boards may go unchecked, especially if boards recognize that the majority of shareholders are passive.
ETFs can exacerbate market volatility.
On May 6, 2010, bad news surrounding Greek debt resulted in an equity market sell-off. That’s understandable, but the S&P 500 dropped 9% in 20 minutes. How does this happen?
The majority of ETFs are open-ended. This means that when the ETF price rises above the NAV of its basket of index components then market makers (called “Authorized Participants” or APs) will sell newly-created ETF shares and buy index constituents. But when the index components sell-off and ETF owners dump their ETFs, then APs are supposed to buy the ETFs and sell the components. In situations where liquidity for the index components dries up (ie bids fall away), APs have been reluctant to perform this arbitrage function. The downward spiral quickly becomes self-fulfilling.
The Flash Crash of 2010 resulted in circuit breakers being applied to slow down these death spirals. But that seemed to have backfired on Aug 24, 2015 when 327 ETFs were halted due to limit down restrictions and 11 ETFs were halted 10 or more times. Again, APs were inactive when pricing clarity was limited.
It would be unfair to pin all the blame on APs for ETF dysfunction. Many of the most volatile ETFs are leveraged synthetic ETFs designed to provide multiples of daily index percentage rises and falls. Instead of buying the physical assets to replicate the index, synthetics enter into swap agreements with a counter-party (which many times may be an affiliated entity) basically guaranteeing the index return. How that counter-party offsets the liability is fairly irrelevant to the end user of an ETF. But during periods of extreme volatility, counter-party risk can create a domino effect that’s unanticipated. I don’t know about you but I still get a little nervous whenever I see the words “counter-party” and “leverage” in the same paragraph.
Flash crashes are just one symptom or warning sign of a situation that has spiraled a bit too far. As indexing grows it becomes more self-fulfilling. Unlike other market phenomena, there is no self-correcting mechanism. In my opinion, we are reaching a tipping point where active managers are becoming more important than ever. Fees have been negotiated down, many funds have closed and passive continues to snowball (US ETFs in January attracted $68.1 bn the most ever in a single month). But until the remaining managers show some outperformance, the default mechanism will continue to move toward passive. Ironically most active managers I have interviewed feel that this outperformance can only come when the market sells off. Assuming the sell off unwinds the overowned index names, active managers need to be invested in those less-followed, un-indexed, and ignored ideas or else they get swept down the same drain. Unconflicted independent research that examines these less-followed ideas will be critical in surviving the next market decline. And those active managers who want to outperform during that period need to be investing in those ideas now in order to be the winners going forward.
Has Passive Investing Peaked?Written by Warren Yeh
Head of US, Smartkarma

Co-written by Tan Chin Hwee CFA, CA
CEO-Asia Pacific, Trafigura
Tan Chin Hwee and Sangeet Paul Choudary For The Straits Times
With physical trade possibly declining, Singapore can expand and license its digital trade platform to global users. It can become a free data port as well.
Singapore’s strategic location has helped the island nation become a hub for global trade. But with digital technologies changing the nature of trade, Singapore’s locational and infrastructural advantages may no longer be as strong a control point as they were in the past. Singapore must reinvent itself as a hub for the age of digital trade.
And in the modern world dominated by platform companies that offer ways for customers and companies to connect with one another, Singapore must think like a platform nation.
It can make use of its innate advantages to develop ways for other nations and industries to connect through it digitally.
Today, digital technologies are changing the nature of globalisation in two important ways. First, automation of manufacturing is moving manufacturing back west. Adidas, for example, is moving production from China to Germany, owing to the lower cost of robotic manufacturing in Germany. As Western companies re-shore manufacturing, East-West physical trade flows, including the ones moving through Singapore’s hub, are likely to go down.
Second, global SME (small and medium-sized enterprise) trade is on the rise, driven by the rapid growth of digital platforms such as Alibaba and Tencent, which allow much smaller enterprises to participate in global trade without the need to invest in their own supply chains.
As these platforms scale further, we may see control over trade shifting from political countries to these digital platforms.
To formulate these new control points, Singapore must think like a digital platform. To understand this better, let us consider how Google succeeded in dominating the smartphone industry with the Android platform.
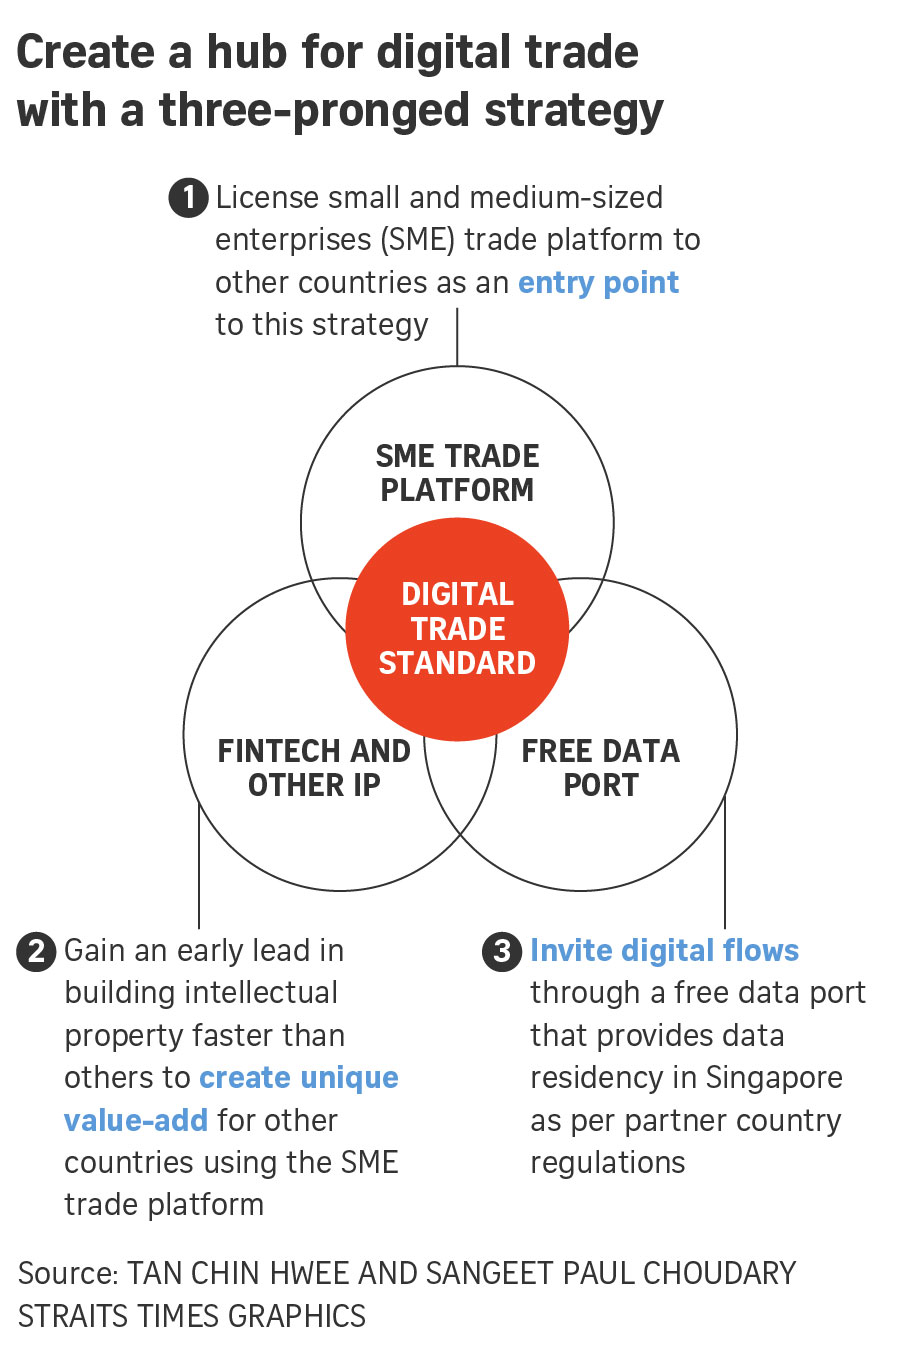
Google used a three-pronged strategy. First, it drove the adoption of Android among smartphone manufacturers such as Samsung by open-sourcing the operating system. This was Google’s entry strategy.
Second, it controlled unique IP (intellectual property) in the form of Google Maps and the Google Play app store. This IP served as Google’s key differentiator. Every smartphone manufacturer needed to license this IP. Google continues to invest in improving its mapping data and growing its app store as these two sources of IP make Android more attractive as the standard.
Third, Google leveraged its neutral position in the smartphone industry – as a non-manufacturer – to allay competitive fears among manufacturers who were using Android.
This three-pronged strategy – an adoption strategy with partners, control of unique IP, and the benefits of a neutral position – established Android as the dominant standard.
Singapore can leverage a similar three-pronged strategy to establish a standard for digital trade. Such a standard would enable multiple participating countries to collaborate, while enabling Singapore to establish itself as a hub for digital trade.
Much like Google’s strategy outlined above, Singapore’s road map to establishing a standard will involve an adoption strategy with partners, control of unique IP differentiators, and the benefits of a neutral position.
We elaborate further on these three initiatives below.
1. Drive adoption by licensing the SME trade platform to emerging economies
The first part of the three-pronged strategy serves as the entry point.
One such entry point could be digital SME trade, which has been growing with the rise of digital platforms. In the first quarter of this year, Singapore will launch its own SME trade platform, built on the blockchain, to allow SMEs to conduct digital commerce securely and seek new business partners and distributors, while managing a common audit trail between counterparties on the platform.
In the first instance, this platform allows Singapore SMEs to participate in digital commerce and grow their businesses. However, it can also serve as an entry point towards a larger strategy.
Once the success of the SME trade platform is demonstrated within Singapore, the country could open its platform technology, know-how and processes to emerging economies that are seeking growth driven by digital SME trade. These partner countries understand the importance of digital SME trade but do not have the capabilities to create such a platform, nor do they want their SME sector to become over-reliant on commercial platforms such as Amazon and Alibaba. When multiple countries start using the same platform, they start subscribing to the same data standards, leading to greater cooperation and interoperability among them.
This serves as a first step towards creating a standard for collaboration in digital trade. However, it does not yet position Singapore as the hub. This leads us to the second part of the three-pronged strategy.
2. Invest in IP
In order to create the right control points and be a hub for digital trade, Singapore must invest in creating unique IP that other countries using the SME trade platform find valuable. It needs to create and control unique IP that adds value to users of the SME trade platform.
Singapore already has a head start here with its financial technology (fintech) strategy. By creating a regulatory sandbox, the country is already encouraging innovation in fintech.
The fintech innovations emerging from Singapore can be used as value-add plug-ins to the SME trade platform.
For example, a data-driven credit scoring system could be used to extend trade financing to SMEs based on their trade activity data gathered on the platform. Similarly, insurance premiums for trade shipments could be personalised based on proprietary data from the platform. Other countries using the platform may not possess the technology or financial infrastructure to build these capabilities themselves, making the platform even more attractive for them to adopt.
As more countries use the platform, other IP creators could find it more attractive to create IP for this platform, owing to the higher demand. This growing IP, in turn, leads to greater usage of the platform. This creates a virtuous circle.
This would position Singapore as the central and most powerful point for processing digital trade data from participating countries, making it a hub for digital trade.
Other countries using the platform would send their digital trade data to Singapore using the platform’s secure APIs (application programming interfaces), in order to benefit from Singapore’s fintech innovation that plugs in to the platform.
This IP creates a unique and inimitable differentiator. It also allows Singapore to monetise digital trade activity in other countries, positioning it as a virtual hub over trade flows.
3. Become a free data port and set a standard for digital trade
As Singapore becomes the hub for digital trade, it can also leverage its neutral position to allay fears among partner countries.
In the past, Singapore’s creation of a free trade port attracted physical trade flows to the country. We believe that Singapore would be well served by establishing a similar free data port that positions it as a neutral country for processing global trade data.
A free data port – an idea also proposed by former civil service head Peter Ho at the IPS-Nathan Lectures last May – would allow data from other countries to be stored and processed in Singapore, but in accordance with their individual country-specific data jurisdictions.
A free data port and neutral governance further position Singapore’s SME trade platform as a superior alternative to other commercial platforms that facilitate SME trade.
We believe this three-pronged strategy will help Singapore to establish a standard for digital trade. As locational advantages become less relevant in a digital world, Singapore can re-position itself as a hub by constantly investing in and controlling unique IP that other trading countries value, while maintaining a neutral stance through a free data port.
There are a few specific nuances to consider here. First, digital trade allows Singapore to be location-agnostic. In physical trade, Singapore benefited only from trade flows towards Asean. But in digital trade, the SME platform could be licensed to small nations in Africa, Central America and Eastern Europe.
We believe that Singapore’s head start with fintech IP, coupled with its neutral stance as a free data port, will make the SME platform attractive.
Second, in addition to providing a free data port, Singapore could also act as the neutral convener and facilitator for driving digital and data policies across participating countries. To the extent that many of these countries are emerging economies and have still not fully evolved their data policies, this proactive facilitation further strengthens Singapore’s position as a neutral hub.
Third, to be a strong hub for digital trade, Singapore must continue to invest heavily in machine learning and data-analytic capabilities to gain intelligence from global trade data flows.
On a final note, physical trade will continue to be important as well. In addition to preparing for digital trade, the country should strengthen its hub position in physical flows by capturing and controlling important data.
For example, one way to exert greater control over supply chains may involve digitising warehouses and other supply-chain assets across South-east Asia.
Much as platforms like Airbnb create a market by digitising spare accommodation, Singapore could create new digital markets around the trade taking place through its port by digitising spare assets that lie further upstream and/or downstream from its port.
While others try to compete with the port only at a physical level, this could enable the country to combine flows through the port with these new data points to exert more control over the supply chain and make itself a preferred port.
We are entering a new phase of globalisation, where digital technologies rapidly change the nature of trade. With the starting points of this strategy in place, Singapore is well positioned to create a hub for trade in this new world across physical and digital trade. But to succeed in this new phase, the country needs to think like a digital platform.
•Tan Chin Hwee works in a multinational logistics company headquartered in Singapore and has a family office that has been investing in technology for many years. Sangeet Paul Choudary is founder of Platformation Labs in Singapore, co-author of Platform Revolution and author of Platform Scale.
First Published in The Straits Times on February 14, 2018. View here: https://goo.gl/kvg3jK

by Michael J. Howell
Managing Director, Crossborder Capital
Read more of Michael’s work on Smartkarma!
The recent injection of nearly US$10 trillion of Central Bank ‘quantitative easing’ evidences the importance of liquidity to investment valuations, such as bond yields, stock markets and house prices. In short, money moves markets. But it is not just the actions of the grey suits at the US Federal Reserve, the Bank of Japan and the European Central Bank that matter. Savings flows, bank credit, corporate cash flow, cross-border capital inflows and the vast pool of Chinese money also count. In fact, their contributions to Global Liquidity are often now bigger and faster-moving. These swings in Global Liquidity drive asset markets up and down. Peaks in the Global Liquidity cycle typically precede similar asset market peaks, while lows in the Global Liquidity cycle warn of upcoming banking problems and possible economic recession. The chart below shows the relationship between Emerging Market equities and the CrossBorder Capital liquidity data in index form.
Emerging Market Stocks: Deviations of Returns from Trend (LHS) and Liquidity (Index), 1996-2017
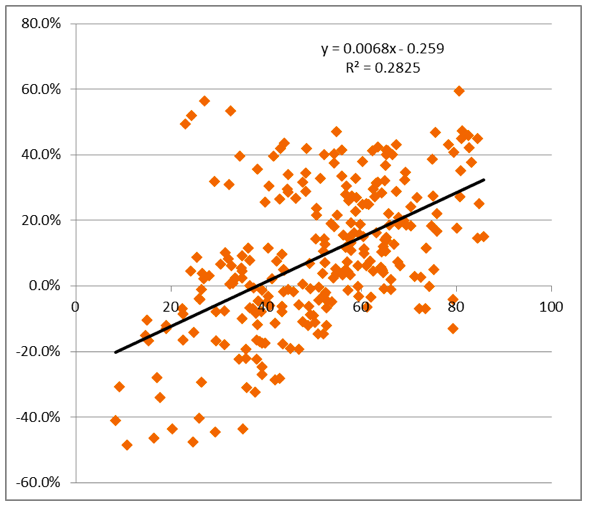
It seems clear that as the World market gets bigger in size it becomes more volatile since banking/ credit crises now hit with an apparent regularity every 8-10 years, such as in 1996, 1974, 1982, 1990, 1997/98, 2007/08. The Y2K technology bubble appears to break this pattern, but still proves the rule because it was pumped up by Central Bank cash. With many policy-makers again debating how much to reduce their recent money creation, another inflection may be now due with typical far-reaching effects? The pool of Global Liquidity total some US$115 trillion, or roughly 50% bigger than World GDP. China (US$30 trillion) and the US (US$28 trillion) dominate the data, with China’s People’s Bank now the largest Central Bank in the World by balance sheet size. Global Liquidity and, notably, credit typically lead to the build-up of financial system vulnerabilities through heightened asset price inflation, leverage and maturity or funding mismatches. Thus, cross-border capital flows frequently provide the marginal source of financing in the run-up to financial crises. Over the last three years alone some US$3 trillion of liquidity has switched back-and-forth between the US, China and the Eurozone. This rollercoaster heightens currency market volatility, which then often spreads into share prices.
But is the impact of liquidity really understood? The circular flow of money is a popular starting point for macroeconomics. Nonetheless, the standard modern textbook introduction using the income-expenditure model is woefully incomplete. It overlooks the fact that economic agents can spend more or less than their incomes because of flows between the real economy and the asset economy. In practice, the interaction between incomes and expenditures are NOT circular at all because these flows of real economy payments are being continuously disturbed by larger flows into and out of the asset economy, and the latter’s dominance means that in practice they can result in large changes in real economy expenditures that are unrelated to either current or past incomes. Because these flows between the real and asset economies are likely to be large when asset prices differ sizeably from their equilibrium levels, asset price valuation is critical to the macroeconomic outlook. The future level of asset prices and hence the value of national wealth, like GDP, are themselves in large part functions of the quantity of money and credit. And, because the financial system can itself create credit, it is central to the determination of macroeconomic outcomes. But strangely the financial system is often ignored in the traditional textbook narratives.
Conventional textbook chapters on ‘Money and Banking’ typically focus on the so-called deposit multiplier. But, again, the World doesn’t work like this. First, money supply can no longer be measured by the retail deposit liabilities of high street banks (e.g. M2). Second, credit, not deposits are what really matter. This model assumes that banks are constrained by the supply of reserve assets and not funding constrained. Yet every liquidity crisis we can think of, and notably 2008, represents a funding problem. In this sense, Central Banks are one among many sources of funding, albeit sometimes an important source. However, the dominance of Western Central Banks is being eclipsed, not just be the availability of often vast off-shore funding pools, such as the Eurodollar Markets, but also by newly emerging authorities, such as the People’s Bank of China (PBoC). Investors should be looking more-and-more at the PBoC and not least because in size it is already one fifth bigger than the US Federal Reserve.
Liquidity operates through two main conduits: (1) the exchange rate and (2) changes to bond and equity risk premia. The drivers consist of both the quantity and also the quality, i.e. different types, of liquidity flows. Specifically, we have found that Central Bank liquidity (now popularly dubbed ‘QE’) impacts the interest rate term structure both directly by pushing down short-term rates and indirectly by raising term premia, particularly at longer investment horizons. In short, the yield curve steepens and by association, lending becomes more profitable as bank margins widen alongside. All this follows because government bonds are held as ‘safe assets’ by many investors. Increases and decreases in perceived systemic risk result in investors demanding either more or fewer ‘safe assets’, and in the process lowering and raising term premia. This, in turn, forces the interest rate yield curve to steepen or flatten, respectively, as investors extend and reduce their investment time horizons. A steeper (flatter) yield curve leads to more (less) duration risk. Because Central Bank liquidity also represents the supply of domestic currency, it follows that more (less) quantitative easing usually leads to a weaker (stronger) nominal exchange rate.
The private sector also a part in exchange rate adjustment. Private sector liquidity measures the cash flow generation (i.e. both new credit and savings) of the domestic private sector, including households, corporations and financial institutions. Greater (less) cash flow generation leads to a rising (falling) real exchange rate. The real exchange rate is here defined as the nominal exchange rate adjusted for some price index, such as consumer prices, but which also includes asset prices. Monetary transmission involves some combination of exchange rate and general price adjustment. In fact, the stronger is private sector liquidity and the tighter Central Bank liquidity, the more that the nominal exchange rate will adjust upwards. In contrast, when strong private sector liquidity is matched by equally strong Central Bank liquidity, the nominal exchange rate will remain roughly constant, with the bulk of the adjustment falling on to prices, and (given that consumer prices tend to be ‘sticky’), in practice, this effectively means higher asset prices.
We find that cross-border flows of foreign liquidity act differently according to whether they affect Developed or Emerging Markets. Large net inflows into Developed Markets (i.e. capital shifts back in to the ‘core’ economies) tend to be associated with lower investor ‘risk appetite’ and the greater demand for ‘safe assets’ such as G7 government bonds. Yet, larger inflows into Emerging Markets (i.e. capital shifts from ‘core’ to ‘periphery’) tend to be associated with increasing ‘risk appetite’ and a bigger demand by foreign investors for Emerging Market risk assets.
How do we use these indicators to invest? In practice, we first select from among markets with strong private sector liquidity, those where the prevailing investor risk appetite is low. Next, we assess Central Bank liquidity. High Central Bank liquidity reinforces our conviction about owning domestic risk assets as opposed to bonds, but warns about possible exchange rate weakness. If the economy is an Emerging Market, then strong cross-border inflows add further to our risk asset conviction. In the Developed Market case, it warns against being too downbeat on the currency and government bonds.

by Winnie Wong – Healthcare Specialist, Australia
Posted on Smartkarma on 12th January 2018
Read more of Winnie’s work by clicking here!
Happy New Year. The start of the year is always a good time to make predictions. Here is mine.
Will the future of equity research be like this:
Me (speaking to my device): “Hello Robo-Analyst, tell me what you think of Google.“
Robo-Analyst: “Good morning Winnie. As of yesterday, I think Google is a hold, and the forecast is good until the close of trading today. Here’s why I made such a recommendation – an online report released overnight mentioned that…“
Like many other industries undergoing technological changes, equity research is another sector that is ripe for disruption. Various asset managers and investment banks are already employing some form of artificial intelligence in their business. In this insight, we will review and discuss the impact of artificial intelligence on the equity research industry.
Artificial intelligence (AI) is a branch of computer science that aims to create intelligent machines. A core part of AI is machine learning – an engineering technique in which the software is not discretely programmed. It involves statistical learning and analysing a large volume of data and relationships. The software can only perform within its given set of parameters and is not capable of thinking outside the square.
AI will change the global industrial ecosystem. By transforming huge amounts of information into valuable insights and thus improving efficiency, not only will it be the main driver of the global economic growth in the future, but it will also be applicable in the equity research and investment process. AI can be used in applications such as judging economic signals, monitoring the risk appetite of portfolios, or dynamically adjusting the investment portfolio to provide more tools for the investment team. It can overcome human weaknesses such as subjectivity and memory deficiency, and process a large amount of data in a short period of time. Also, a machine never sleeps or goes on holiday.
“Humans have biases and sensitivities, conscious and unconscious…It’s well-documented we humans make mistakes. For me, it’s scarier to be relying on those human-based intuitions and justifications than relying on purely what the data and statistics are telling you.” says Babak Hodjat, co-founder of Sentient and a computer scientist who played a role in Apple’s development of Siri.
According to PwC, global GDP is expected to be 14% higher in 2030 as a result of AI, meaning that an additional $15.7 trillion is expected to be added to the global economy. Many of those who work in the financial sector are already speculating how AI will impact their jobs.
Will a robot’s stock pick outperform the market? Not long ago, this speculation became a fact. An artificial intelligence ETF called AI Powered Equity ETF (AIEQ) was launched in October 2017. The AI ETF turned out to be a clear win over the Dow Jones Industrial Average (DJI), Nasdaq Composite Index (IXIC) and S&P 500 (GSPC) indices in the last month.
One Month Return of AIEQ and Market Indices Ending 11 Jan 2018

AIEQ was launched by the US EquBot Corporation and the ETF Managers Group. The fund uses artificial intelligence and machine learning to analyze more than 6,000 listed companies in the US, acquire millions of data points and build numerous financial models, and conduct an in-depth analysis from the current economic situation, future trends and major events of each of the covered companies. It then picks out a portfolio of 70 stocks, which are then used by the fund managers at ETF Managers Group for portfolio allocation. According to the company, its strategy has been backtested but they have declinedto provide historical performance data due to compliance issues.
Notably, EquBot hired IBM supercomputer Watson to provide the last ten years of historical data for US public companies and real estate funds as well as recent economic data to help AIEQ perform fundamental analysis. Essentially, EquBot AI works with Watson to create an equity research arm that is constantly analysing data and financials 24 hours a day, 365 days a year. In this process, there is no artificial bias and downtime.
According to Art Amador, the co-founder of EquBot, the emergence of big data has created a huge challenge for portfolio managers and artificial intelligence can help solve these problems. The birth of AIEQ marks the beginning of how investment firms are exploring more efficient ways to invest and manage its human resources. AI investing may become a mainstream investment category, sitting alongside passive and active investment in an investor’s diversified portfolio.
However, time will tell as to how an AI-powered equity ETF will perform over a longer time period, or whether it is more suitable for shorter-term trading opportunities. Arguably, shorter-term investment calls are based on market sentiment and news, and an AI-powered fund would be able to process these pieces of information at a much faster rate and with better precision than an analyst. On the other hand, forming a longer-term investment thesis requires critical thinking and judgement, both of which cannot be sourced from the current AI technology.
AI has been around for at least a decade in the investment world, but mostly in trading. In 2007, a New York-based company called Rebellion Research launched one of the first AI investment funds. The company’s trading system is primarily based on Bayesian machine learning and predictive algorithms that continuously evolve in response to new external information and past experiences to effectively automate learning and successfully execute equities, fixed income, commodities and foreign exchange. Rebellion successfully predicted the 2008 stock market crash and assigned an F rating to the Greek bonds in September 2009, a month earlier than the official downgrade from Fitch when they still had an A rating.
AHL Dimension Program, the largest investment fund managed by the British alternative investment management group The Man Group, manages $5.1 billion in assets. Approximately half of the profit from that fund was generated from artificial intelligence. Currently, Man Group already has four funds totalling $12.3 billion in assets that incorporate artificial intelligence technology.
Fast forward ten years, four of the top 20 hedge funds are heavily reliant on algorithms trading, according to a London-based fund of funds LCH Investment. Recently we are also seeing AI moving into the equity research realm. Wells Fargo developed its own AI analyst which is aptly called AIERA (Artificially Intelligent Equity Research Analyst). According to the company, AIERA’s primary responsibility is to track stocks and formulate a daily, weekly, and overall view on whether the stocks tracked will go up or down. It works around the clock and is trained to read millions of news stories and make calls on stocks. In October last year, AIERA made a call to sell Facebook at a time when only two other brokerages gave it a similar rating. Even Ken Sena himself, the creator of AIERA and a veteran analyst at Wells Fargo, was recommending the stock with an outperform rating. The investment call issued by AIERA turned out to be incorrect, at least in the short run. On another front, Morgan Stanley has also developed its own AI to churn through thousands of earnings reports and investment data such that their analysts could focus on value-added work and spend more time in front of clients. Other players such as BlackRock and Goldman Sachs are also exploring the benefits of AI within its businesses (you can read more about them in this article What AI Means for Investors).
While we are still very far away from the mind-numbing possibility of robots taking over our jobs as equity research analysts, latest technological developments have certainly made it possible to automate some parts of our job that does not require critical thinking. It is entirely possible that tasks such as scanning news articles, analysing financials, gathering information, manipulating data and building models can be outsourced to our robots. AI will become a powerful analytical tool for analysts in formulating investment calls.
In the future, we will see analysts doing less of the number crunching and scouring of news and financials, but focusing more on critical thinking, formulating investment strategies, spearheading the direction of research, talking to management and industry players, and more importantly, meeting clients and stakeholders.
Like other industries prime for AI disruption, we will see more data scientists being employed by investment firms and potentially move into the front office roles. However, these talents are far and few between, and investment firms will be competing against the likes of Google, Apple, Microsoft and IBM for these data scientists. As a result, the next generation of equity research analysts may be expected to code and make appropriate enhancements to their company’s AI software.

Source: pixabay.com
In 2018, we will continue to see robots taking over more ‘human’ tasks, and we expect that machine learning will become even better and faster in the coming years. However, it is unlikely that AI will ever replace humans, at least not in the SkyNet sense. Advanced machine learning will not evolve into real AI that is capable of having the level of sophisticated thinking, common sense and self-awareness that is found in humans. Unlike an equity research analyst, it will never be able to think outside the square, provide opinions and make judgements beyond its available dataset.
AI may transform our responsibilities and change the skillsets required for an equity research analyst, but it will never replace us.
by Winnie Wong – Healthcare Specialist, Australia
Posted on Smartkarma on 12th January 2018
Read more of Winnie’s work by clicking here!