
 𝛼SK or Search
Hyosung’s Transformation into a Holdco + Four Subsidiaries (Part 3): What's Next?

This note provides an analysis about how the shares of Hyosung Corporation (004800 KS) and its four subsidiaries may trade once they start to trade again on July 13th. Our sum-of-the parts valuation of Hyosung Corp suggests an implied market cap of 6.6 trillion won, which is 39.9% higher than current market cap of 4.7 trillion won. Hyosung Corp shares have been suspended trading from May 29th to July 12th.
The following are the five new entities (including the split ratios) that will be created for Hyosung Group in this reorganization:
- Hyosung Corp - Holding company (0.3928)
- Hyosung TNC - Textile & trade (0.1232)
- Hyosung Heavy Industries - Heavy industries and construction (0.2655)
- Hyosung Advanced Materials - Materials related (0.1276)
- Hyosung Chemicals - Chemicals (0.0908)
Most recently, Korea National Pension Service (NPS) increased its stake in Hyosung Corp to 10.63% (as of June 29th, 2018), up from 10.16% (as of March 30th, 2018). As we mentioned in our report, Hyosung's Transformation into a Holdco + Four Subsidiaries (Part 1), the three key positives of this split-off include a transition from a complex to simple structure, potential for higher valuation of its core businesses, and a transition stage from father to son ownership. The negative factors include market cap limits of the split-off subsidiaries and potentially unwise use of treasury shares.
Balance Sheets of Hyosung Corp (Pre & Post Split) and its Four Major Split Off Companies
The table below shows the balance sheets of Hyosung Corp (pre and post company split) as well as its four major affiliates as of July 1st, 2018. Post the company split off, Hyosung Corp (holdco) has the strongest balance sheet as it was in a net cash position as of July 1st, 2018. Among the four major affiliates, Hyosung Chemicals has the weakest balance sheet, with net debt to equity ratio of 301% and total liabilities/equity ratio of 390% as of July 1st, 2018.
| Balance Sheets of Hyosung Corp (Pre & Post Split) and its Four Major Split Off Companies | |||||||
| July 1, 2018 | Prior to Company Split Off | Post Company Split Off | Post Company Split Off | Post Company Split Off | Post Company Split Off | Post Company Split Off | |
| (Won bn) | Hyosung Corp | Hyosung Corp | Hyosung TNC | Hyosung Heavy Industries | Hyosung Advanced Materials | Hyosung Chemicals | |
| Current Assets | 2,881.2 | 121.4 | 604.5 | 1,345.9 | 476.9 | 332.3 | |
| Cash & Short Term Inv. | 734.7 | 54.8 | 175.2 | 250.2 | 173.2 | 81.2 | |
| Accounts Receivables | 1,151.2 | 34.2 | 259.9 | 522.6 | 208.3 | 126.0 | |
| Inventory | 662.0 | 15.48 | 146.4 | 300.8 | 89.9 | 109.3 | |
| Other Current Assets | 333.3 | 16.9 | 22.9 | 272.3 | 5.5 | 15.7 | |
| PP&E | 3,325.1 | 531.6 | 346.4 | 989.2 | 334.1 | 1,123.7 | |
| Other long term assets | 3,007.6 | 1,217.3 | 538.8 | 821.9 | 563.6 | 229.6 | |
| Total Assets | 9,213.8 | 1,870.3 | 1,489.7 | 3,157.0 | 1,374.6 | 1,685.6 | |
| Current Liabilities | 4,016.4 | 112.4 | 957.8 | 1,788.6 | 443.8 | 716.2 | |
| Short term debt & Cut mat of LTD | 2,675.4 | 32.6 | 670.7 | 1,136.8 | 328.1 | 508.6 | |
| Accounts liabilities | 1,147.1 | 65.1 | 282.0 | 502.8 | 96.5 | 201.4 | |
| Other Current Liabilities | 193.9 | 14.7 | 5.1 | 149.0 | 19.2 | 6.2 | |
| Long term debt | 1,217.0 | 1.1 | 24.3 | 132.3 | 451.8 | 606.3 | |
| Other Long term Iiabilities | 464.3 | 207.3 | 68.9 | 298.1 | 28.2 | 19.4 | |
| Total Liabilities | 5,697.7 | 320.8 | 1,051.0 | 2,219.0 | 923.8 | 1,341.9 | |
| Total Equity | 3,516.1 | 1,549.5 | 438.7 | 938.0 | 450.8 | 343.7 | |
| Current Ratio (%) | 71.7% | 108.0% | 63.1% | 75.2% | 107.5% | 46.4% | |
| Total Liabilities/Equity (%) | 162.0% | 20.7% | 239.6% | 236.6% | 204.9% | 390.4% | |
| Net Debt/Equity (%) | 89.8% | NC | 118.5% | 108.6% | 134.6% | 300.8% | |
| Source: Company data; NC = net cash | |||||||
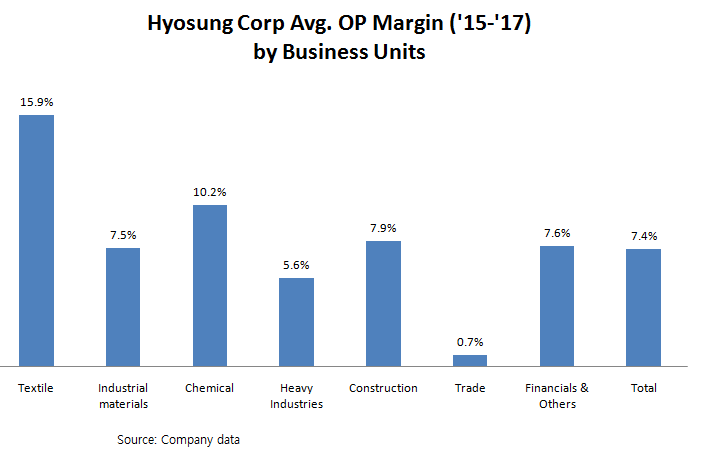
Hyosung Corp Financials Breakdown by Units

| Hyosung Corp Financials Breakdown by Units (2017) | |||||||||
| (Won bn) | Textile | Industrial materials | Chemical | Heavy Industries | Construction | Trade | Financials & Others | Consolidated adjustments | Total |
| Sales | 2,137 | 2,410 | 1,501 | 2,249 | 1,152 | 2,280 | 816 | 0 | 12,546 |
| Operating Profit | 249.8 | 168 | 131 | 66 | 106 | 15.5 | 48 | -14 | 771 |
| Assets | 2,331 | 3,147 | 1,762 | 2,269 | 534 | 430.9 | 6,517 | -2,456 | 14,535 |
| Liabilities | 1,041 | 1,169 | 482 | 1,156 | 575 | 552 | 6,285 | -588 | 10,672 |
| Equity | 1,289 | 1,978 | 1,281 | 1,113 | -41 | -121 | 232 | -1,868 | 3,863 |
| Operating Margin (%) | 11.7% | 7.0% | 8.7% | 2.9% | 9.3% | 0.7% | 5.9% | -- | 6.1% |
| Liabilities/Equity (%) | 80.8% | 59.1% | 37.6% | 103.9% | -1409.3% | -455.5% | 2710.9% | -- | 276.2% |
| Source: Company data | |||||||||
| Hyosung Corp Financials Breakdown by Units (2016) | |||||||||
| (Won bn) | Textile | Industrial materials | Chemical | Heavy Industries | Construction | Trade | Financials & Others | Consolidated adjustments | Total |
| Sales | 1,979 | 2,384 | 1,194 | 2,557 | 892 | 2,039 | 883 | - | 11,929 |
| Operating Profit | 313 | 218 | 148 | 185 | 82 | 9 | 73 | -12 | 1,016 |
| Assets | 2,142 | 3,179 | 1,750 | 2,313 | 1,043 | 390 | 5,911 | -2,608 | 14,121 |
| Liabilities | 1,024 | 1,151 | 348 | 1,141 | 805 | 307 | 6,185 | -682 | 10,280 |
| Equity | 1,118 | 2,028 | 1,402 | 1,172 | 238 | 82 | -274 | -1,926 | 3,841 |
| Operating Margin (%) | 15.8% | 9.1% | 12.4% | 7.2% | 9.2% | 0.4% | 8.3% | -- | 8.5% |
| Liabilities/Equity (%) | 91.6% | 56.8% | 24.8% | 97.4% | 338.2% | 374.4% | -2,257.3% | -- | 267.6% |
| Source: Company data | |||||||||
| Hyosung Corp Financials Breakdown by Units (2015) | |||||||||
| (Won bn) | Textile | Industrial materials | Chemical | Heavy Industries | Construction | Trade | Financials & Others | Consolidated adjustments | Total |
| Sales | 2,105 | 2,375 | 1,068 | 2,493 | 891 | 2,875 | 652 | - | 12,458 |
| Operating Profit | 425 | 150 | 101 | 162 | 48 | 30 | 56 | -22 | 950 |
| Assets | 2,891 | 2,131 | 1,556 | 2,280 | 1,214 | 633 | 5,700 | -2,390 | 14,013 |
| Liabilities | 1,625 | 962 | 322 | 1,224 | 790 | 511 | 5,803 | -697 | 10,541 |
| Equity | 1,265 | 1,169 | 1,234 | 1,055 | 424 | 121 | -104 | -1,693 | 3,472 |
| Operating Margin (%) | 20.2% | 6.3% | 9.5% | 6.5% | 5.4% | 1.0% | 8.6% | -- | 7.6% |
| Liabilities/Equity (%) | 128.5% | 82.3% | 26.1% | 116.0% | 186.3% | 422.3% | -5579.8% | -- | 303.6% |
| Source: Company data | |||||||||
Sum-of-the Parts Valuation of Hyosung Corp and Its Affiliates Pre and Post Company Split
Our sum-of-the parts valuation of Hyosung Corp suggests an implied market cap of 6.6 trillion won, which is 39.9% higher than current market cap of 4.7 trillion won. Our valuation methodologies for the break-up value are as follows:
- Hyosung Heavy Industries - We used Hyundai Heavy Industries, Doosan Heavy Industries, and GS E&C as comps. Taking the book value of Hyosung Heavy Industries as of July 1st and applying the average P/B multiple, we derived an equity value of 568 billion won for Hyosung Heavy Industries.
- Hyosung Advanced Materials - We used Kolon Industries as the comp. Applying an estimated annual net profit of 134 billion won and applying a P/E of 11.1x (5% premium to Kolon Industries), we derived an equity value of 1,482 billion won for Hyosung Advanced Materials.
- Hyosung Chemical - We used Lotte Chemical and Kumho Petrochem as comps. We applied a 20% discount to the average P/E multiple of these comps. Applying an estimated net profit of 95 billion won, this suggests an equity value of 414 billion won for Hyosung Chemical.
- Hyosung TNC - We used Taekwang Industrial and Huvis as comps. We applied a 10% discount to the average P/E multiple of these comps. Applying an estimated net profit of 260 billion won, we derived an equity value of 2,606 billion won for Hyosung TNC.
- Hyosung Corp (Holdco) - To derive the value of Hyosung Corp, we added all the market caps of the four affiliates and after applying a 30% discount and taking into account its ownership stake of 42.1% (this is ownership by 3 major shareholders + treasury shares; assuming that the Holdco will swap the shares sold by the major owners of the four affiliates) and adjusting for net cash , this resulted in a value of 1,515 billion won.
Hyosung Corporation (004800 KS) shares were trading at P/E of 13.8x (using 2017 earnings) and 10.3x (using 2018 consensus earnings estimates) prior to the company split. Hyosung Corp's current market cap is 4.7 trillion won and the consensus net profit forecast is 459 billion won in 2018.
| Implied values of Hyosung Corp (Holdco) | (Won bn) |
| Hyosung Heavy industries | 568 |
| Hyosung Advanced Materials | 1,482 |
| Hyosung Chemical | 414 |
| Hyosung TNC | 2,606 |
| Total | 5,069 |
| Implied value (post 30% discount) | 3,548 |
| Net cash | 21 |
| Hyosung Corp NAV (Holding Co's stake): 42.1% + Net cash | 1,515 |
| Source: Companies data, WiseFN, Our Estimates |
| Implied values of Hyosung Corp + Its 4 Major Affiliates | (Won bn) |
| Hyosung Heavy industries | 568 |
| Hyosung Advanced Materials | 1,482 |
| Hyosung Chemical | 414 |
| Hyosung TNC | 2,606 |
| Hyosung Corp (Holdco) | 1,515 |
| Total mkt cap | 6,584 |
| Current mkt cap | 4,706 |
| Expected upside (%) | 39.9% |
| Source: Companies data, WiseFN, Our Estimates |
| Comparable Companies Analysis of Hyosung Heavy Industries (Heavy Industries & Construction Business Units) | ||||
| Hyundai Heavy Industries | Doosan Heavy Industries | GS E&C | Average | |
| P/E (x); 2018E | NM | 4.9 | 6.2 | 5.5 |
| P/B (x); 2017 | 0.5 | 0.3 | 1.0 | 0.6 |
| OP Margin (%); 2018E | -0.2% | 7.3% | 7.8% | 5.0% |
| ROE (%); 2018E | -1.7% | 3.4% | 15.7% | 5.8% |
| Sales (Won bn); 2018E | 131,175 | 15,478 | 12,313 | 52,989 |
| Net profit (Won bn); 2018E | -199 | 341 | 539 | 227 |
| Operating profit (Won bn); 2018E | -232 | 1,133 | 961 | 621 |
| Mkt cap (Won bn) | 6,640 | 1,664 | 3,327 | 3,877 |
| Equity (Won bn); 2017 | 12,372 | 6,566 | 3,240 | 7,393 |
| Book value of Hyosung Heavy Industries (Won bn) | 938 | |||
| P/B (x) | 0.6 | |||
| Implied value (mkt cap) of Hyosung Heavy Ind. (Won bn) | 568 | |||
| Source: Companies data, WiseFN, Our Estimates | ||||
| Comparable Companies Analysis of Hyosung Advanced Materials | |
| Kolon Industries | |
| P/E (x); 2018E | 10.5 |
| P/B (x); 2017 | 0.7 |
| OP Margin (%); 2018E | 4.3% |
| ROE (%); 2018E | 6.9% |
| Sales (Won bn); 2018E | 4,964 |
| Net profit (Won bn); 2018E | 144 |
| Operating profit (Won bn); 2018E | 212 |
| Mkt cap (Won bn) | 1,518 |
| Equity (Won bn); 2017 | 2,322 |
| Avg. OP (Won bn) of Hyosung Advanced Materials ('15-'17) | 179 |
| Avg. OP Margin of Hyosung Advanced Materials ('15-'17) | 7.5% |
| Est. NP (Won bn) of Hyosung Advanced Materials | 134 |
| P/E (x) | 11.1 |
| Implied value (mkt cap) of Hyosung Advanced Materials (Won bn) | 1,482 |
| Source: Companies data, WiseFN, Our Estimates | |
| Comparable Companies Analysis of Hyosung Chemical | |||
| Lotte Chemical | Kumho Petrochem | Average | |
| P/E (x); 2018E | 5.4 | 5.5 | 5.4 |
| P/B (x); 2017 | 1.0 | 1.8 | 1.4 |
| OP Margin (%); 2018E | 16.0% | 10.2% | 13.1% |
| ROE (%); 2018E | 17.5% | 21.7% | 19.6% |
| Sales (Won bn); 2018E | 17,097 | 5,540 | 11,319 |
| Net profit (Won bn); 2018E | 2215 | 625 | 1420 |
| Operating profit (Won bn); 2018E | 2737 | 567 | 1652 |
| Mkt cap (Won bn) | 11,876 | 3,458 | 7,667 |
| Equity (Won bn); 2017 | 12,255 | 1,957 | 7,106 |
| Avg. OP (Won bn) of Hyosung Chemical ('15-'17) | 127 | ||
| Avg. OP Margin of Hyosung Chemical ('15-'17) | 10.2% | ||
| Est. NP (Won bn) of Hyosung Chemical | 95 | ||
| P/E (x) | 4.4 | ||
| Implied value (mkt cap) of Hyosung Chemical (Won bn) | 414 | ||
| Source: Companies data, WiseFN, Our Estimates |
| Comparable Companies Analysis of Hyosung TNC | |||
| Taekwang Industrial | Huvis | Average | |
| P/E (x); 2017 | 9.0 | 13.3 | 11.1 |
| P/B (x); 2017 | 0.5 | 0.7 | 0.6 |
| OP Margin (%); 2017 | 8.3% | 2.3% | 5.3% |
| ROE (%); 2017 | 5.3% | 5.6% | 5.5% |
| Sales (Won bn); 2017 | 2,916 | 1,281 | 2,099 |
| Net profit (Won bn); 2017 | 179 | 23 | 101 |
| Operating profit (Won bn); 2017 | 241 | 30 | 135.5 |
| Mkt cap (Won bn) | 1,609 | 305 | 957 |
| Equity (Won bn); 2017 | 3,174 | 407 | 1,791 |
| Avg. OP (Won bn) of Hyosung TNC ('15-'17) | 347 | ||
| Avg. OP Margin of TNC ('15-'17) | 7.8% | ||
| Est. NP (Won bn) of Hyosung TNC | 260 | ||
| P/E (x) | 10.0 | ||
| Implied value (mkt cap) of Hyosung Chemical (Won bn) | 2,606 | ||
| Source: Companies data, WiseFN, Our Estimates |
Major Events from May 29th to July 12th (Start of tariff war between US and China)
Although we have a positive view of the Hyosung Corp split off, one of the major recent concerns is the start of the tariff war between the US and China. For now, it remains to be seen whether the two nations will manage to control this tariff war to minimize the damage or whether it will spiral out of control.
Since end of May, many industrial related stocks in Korea that are sensitive to the growth of the Chinese economy have taken a beating. For example, since May 29th, Hyundai Heavy Industries and Doosan Heavy Industries' share prices are down 17% and 24%, respectively. These two companies are comps to Hyosung Heavy Industries. Likewise, Hyosung Corp (holding company) will likely be compared to other holding companies with major industrial related affiliates including Hyundai Heavy Industries Holdings (267250 KS) and Doosan Corp (000150 KS). Since May 29th, Hyundai Heavy Industries Holdings and Doosan Corp's share prices are down 11.8% and 6.9%, respectively. These holding companies have also been negatively impacted by the weaker share prices of their industrial sector related affiliates and continued concerns about the US and China tariff war.
In the near term, this tariff war between China and US is perhaps the most important factor that could put a cap of the share prices of the Hyosung Corp and its four major affiliates once they start trading again on July 13th.
- Unlock research summaries
- Follow top, independent analysts
- Receive personalised alerts
- Access Analytics, Events and more
Join 55,000+ investors, including top global asset managers overseeing $13+ trillion.
Upgrade later to our paid plans for full-access.

- KRX Plans to Launch a New Index Called 'KOSPI 200 Top 10'14 Jun 2021
- Looking Ahead to the KOSPI 200 Rebalance in November 202104 Jun 2021
- KOSPI 200, KOSDAQ 150, & KRX 300 Indices Rebalance Changes - May 202125 May 2021
- Hyosung’s Transformation into a Holdco + Four Subsidiaries (Part 3): What's Next?13 Jul 2018
- Hyosung's Transformation into Holdco + Four Subsidiaries (Part 2): A Lot of Controversy16 Mar 2018
- Hyosung's Transformation into a Holdco + Four Subsidiaries (Part 1)04 Jan 2018
- Hottest Selling Apparel Item in Korea This Summer - Rash Guard11 Aug 2016