In this briefing:
- Oil Exploration: We Expect a Resurgence in 2019 Pointing to Strong Performance for E&Ps
- Maoyan Entertainment (猫眼娱乐) Post-IPO: The CNY Box Office Catalyst Hasn’t Materialized
- Hansoh Pharma IPO Preview: A Decent Story Tarnished by a Huge Pre-IPO Dividend
- Baltic Dry – It’s That Time of Year. Again. [2019 Version]
1. Oil Exploration: We Expect a Resurgence in 2019 Pointing to Strong Performance for E&Ps

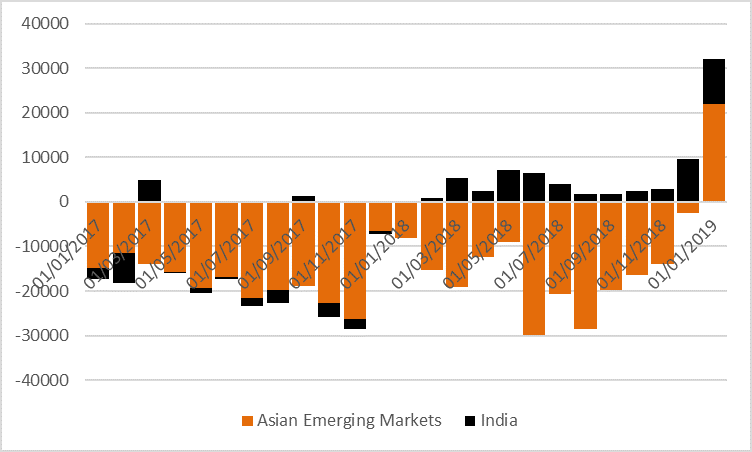
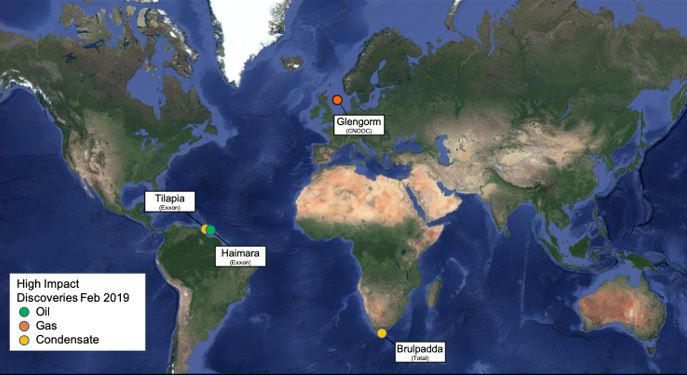
We see oil exploration making a comeback in 2019, as drilling spending sees an increase and on the back of encouraging well results year to date. Already in 2019 there have been 4 high impact discoveries in the UK, South Africa and Guyana. Given the need of companies, especially the majors, to replenish their portfolios, there will still be a number of frontier, high impact wells being drilled. The areas where we see material exploration wells being drilled this year are Guyana, US GoM, Mexico, Brazil the Eastern Mediterranean and West Africa.
If there is some exploration success, the pure-play exploration companies will be good performers, especially those that have exposure to several wells that could be material relative to their size. A pick up in drilling will also be positive for the offshore drilling companies and seismic names. We look at the merits and pitfalls of investing in exploration, performance in 2018, outlook for 2019, the debate over exploring for resource versus buying it, how the economics of exploration have improved and the impact of the time value of money.
2. Maoyan Entertainment (猫眼娱乐) Post-IPO: The CNY Box Office Catalyst Hasn’t Materialized

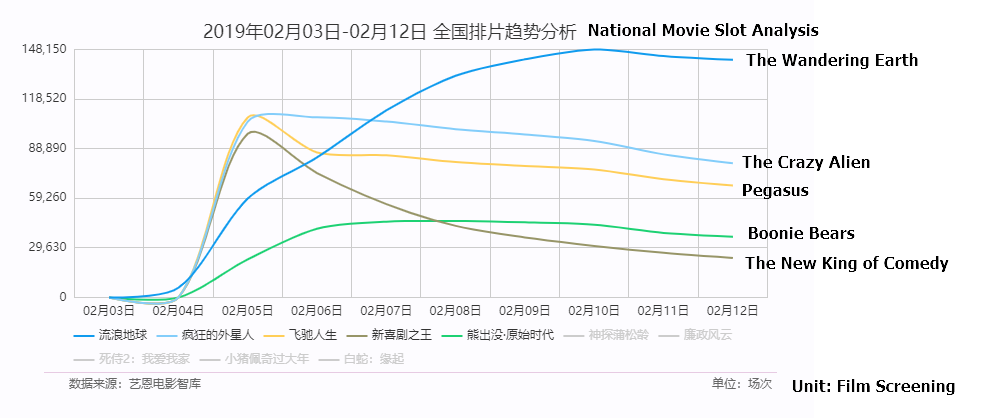
We mentioned in our previous note prior to the listing of Maoyan Entertainment on Feb 4th that Chinese New Year (CNY) Box office from the two movies, namely Pegasus and The New King of Comedy that the company invested could be a catalyst post listing. However, our analysis of CNY box office data suggests although Pegasus reported box office revenues slightly north of RMB 1bn, it is far behind the number one movie, The Wandering Earth’s RMB 2bn box office. In addition to the company-specific movie investment, the overall box office for the CNY holiday has been disappointing, suggesting a challenging year for the movie industry in 2019.
Our previous coverage on Maoyan Entertainment
- Entertainment Plus (猫眼娱乐) IPO: The Engineered Movie Ticketing Leader that Runs Out of Steam (Part 1)
- Entertainment Plus (猫眼娱乐) IPO: The Coming Regulatory Bang Isn’t That Bad (Part 2)
- Maoyan Entertainment (猫眼娱乐) IPO: Turning Profitable, Thoughts on Valuation
- Maoyan Entertainment (猫眼娱乐) IPO: Lackluster Demand but CNY Blockbusters Could Be a Catalyst
3. Hansoh Pharma IPO Preview: A Decent Story Tarnished by a Huge Pre-IPO Dividend

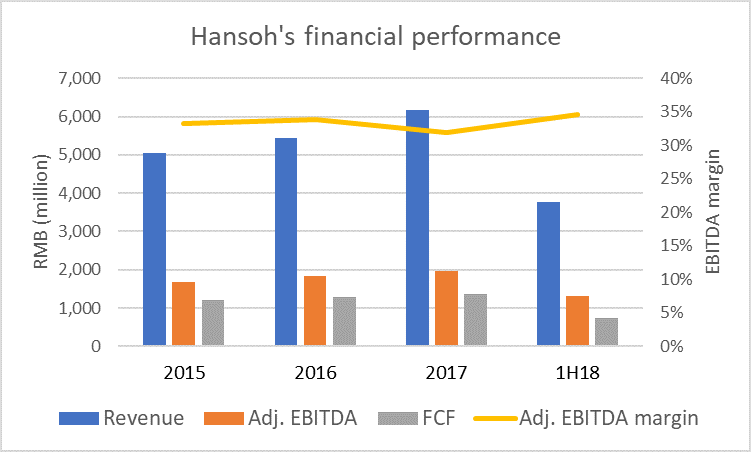
Hansoh Pharmaceutical (HANSOH HK) claims to be one of the few R&D driven Chinese pharmaceutical companies. According to press reports, Hansoh aims to launch its Hong Kong IPO to raise $1 billion this month. Over the track record period, Hansoh’s financial performance shows accelerating revenue growth, relatively stable margins and solid cash generation.
Hansoh has the elements of a decent growth story, but our optimism is tempered due to mixed prospects for its drugs. Also, the huge pre-IPO dividend of RMB4.0 billion ($0.6 billion) will likely raise questions on the timing and size of the IPO.
4. Baltic Dry – It’s That Time of Year. Again. [2019 Version]

This insight starts with a bit of history. It is entirely extraneous to the data, but I think the history is kind of fun (iron ore, Baltic Dry, and shipping has been a ‘hobby’ of mine for years). If you want to get right to the data, go to the Thin Red Line.
On the 24th of May, 1744, an announcement appeared in The Daily Post (The Daily Poſt) that the Virginia and Maryland coffee house in Threadneedle Street, London (just east of the Bank of England) had changed its name to Virginia and Baltick Coffee House.
This is to give notice that the House, late the Virginia and Maryland Coffee-house in Threadneedle Street, near the Royal Exchange, is now open’d by the Name of the Virginia & Baltick Coffee-house, where all Foreign and Domestick News are taken in ; and all Letters or Parcels, directed to Merchants or Captains in the Virginia or Baltick Trade will be carefully deliver’d according as directed, and the best Attendance given, by Reynallds and Winboult.
Note, Punch made in any Quantity, in the greatest Perfection, without Adulteration, which is seldom found in any of the most noted Houses ; also Brandy, Rum, and Arrack (neat as imported) are sold in the Vaults under the Coffee-House, at the lowest Prices; where all Customers, we have had the Favour of serving at our late Warehouse in Leadenhall Street, we hope will continue to send their Orders as above.
We have receiv’d Advice, that Several Bags of Letters and Parcels are coming which are directed to be left at the above Coffee-House
This was perhaps because Virginia and Maryland as a name was slightly redundant. Virginia and Maryland are next to each other (if you dropped cargo in Baltimore, you went past Virginia to get there). It was perhaps because trade with Russia and Baltic countries in tallow (from Russia) used to make candles and soap [more candles than soap as Georgian England was still under the idea bathing might invite the plague to enter the pores], flax, hemp (both from modern-day Estonia and Latvia, and Russia), and other goods was fast climbing after The Muscovy Company (originally founded as The Merchant Adventurers to New Lands in 1551 to look for a northeast passage to China) lost its monopoly (enjoyed since 1555) on English trade with Russia in 1698 (though the company’s activities had been somewhat or at times largely curtailed for 50 years after the execution of Charles I of England in 1648).
The Baltic routes were effectively the same as created by the Hanseatic League many hundreds of years before when German traders in the Baltic traded wares down to the Netherlands and even London, from Livonia (Riga and northward) or Livländ as the Hansa states would have called it. And the same products were shipped on that route for almost a thousand years.
In Regency/Georgian England, flax, for example, came from Königsburg (54-55º N at 21º E), then Memel (Dermemel on the map) just up the coast, Libnau a bit further north, Riga just off the map at around 56º N, then Pernel (Latvia), Revel (Estonia), and St Petersburg further to the northeast (further off the map unfortunately). Timber imports grew dramatically after the Great Fire of London, and as imports grew and English shipbuilding increased, timber to build ships (including specifically, masts) was sourced from Norway in the late 1600s then increasingly the East Country (north Europe, Livonia (specifically Memel)) and Russia.

In any case, the new name more accurately represented the business interests of those who congregated there.
The Virginia & Baltick was the place to source North Atlantic and Baltic cargoes, and cargoes rose in volume dramatically from the mid 1700s through the mid 1800s, with a drop only in the early 1810s.
In 1810, the Virginia & Baltick took over the premises of a nearby establishment called the Antwerp Tavern – also on Threadneedle – which was a considerably larger building (in the Hearth Tax (an annual levy of two shillings per annum, to make up the shortfall of ale and beer taxes paid to the sovereign) returns of 1662 it was noted as having 18 hearths). It was renamed the Baltic Coffee House then (it was also periodically the meeting place of the Albion Lodge of Masons).
Long since replaced, as far as I can tell it was located on the SE corner of Threadneedle and the alley behind the Royal Exchange. By 1823, the wild speculations in commodities and the laxity of theretofore informal arrangements on the Second Floor made it imperative for the senior tallow chandlers, soapmakers, and cargo brokers to form a Member’s Club (limited to 300). Rules were established (they are below in the Appendix).
In 1857, the Virginia & Baltick established a company, The Baltic Company Limited, and arrangements were made to take over the lease of the South Sea House (original home to the South Sea Company) at the end of Threadneedle Street. In 1900, the Baltic Exchange was incorporated as a private limited company – the Baltic Mercantile And Shipping Exchange, Limited. and took over the London Shipping Exchange. In 1903, the company established its own purpose-built premises in St. Mary’s Axe. In 1992, an IRA bomb demolished 30 St. Mary’s Axe and a few years later, permanent premises were found at 38 St. Mary’s Axe.
Nota Bene: Before the Great Fire of 1748, the most famous of London’s coffee shops were on the south side of the Royal Exchange – with most in the small area named Exchange Alley and on Birchin, and with Lloyd’s on Lombard Street (corner of Lombard and Abchurch Lane if I remember correctly). The area north and west of the Exchange was oriented towards taverns. The location of the Antwerp Tavern in relation to the map below was roughly where the bolded name of Antwerp Tavern is in the paragraph above.

In 1985, the Baltic Exchange first calculated its Baltic Freight Index (now the Baltic Dry Index) as an “assessment” of conditions and charter rates amongst a panel of independent ship brokers across nearly two-dozen specific routes (all routes reported have year-round fixtures – not seasonal routes like the Great Lakes) and ship sizes (and since July 1, 2009 is an average of Handysize, Supramax, Panamax, and Capesize Timecharter averages), the data for which is then verified and averaged by the Exchange, and disseminated to members. The route specifics are quite detailed and require “massaging” in order to get normalized data from the specified delivery item (for Capesize Route C2, it is a 180kmt DWT ship on 18.2m SSW draft, max age 10yrs, LOA 290m, beam 45m, TPC 121, 198kcbm grain, 14 knots laden, 15 knots ballast on 62mt fuel oil (380cst) no diesel at sea with the route details as below).
C2: Tubarao to Rotterdam. 160,000lt iron ore, 10% more or less in owner’s option, free in and out. Laydays/cancelling 20/35 days from index date. 6 days, Sundays + holidays included all purposes. 6 hrs turn time at loading port, 6 hrs turn time at discharge port, 0.5% in lieu of weighing. Freight based on long tons. Age max 18 yrs. 3.75% total commission. |
There are audits of the brokers, and no shipbrokers are allowed to have “money in the market.” A full index methodology document is available for those who care for it (message me for the PDF).

It’s That Time Of Year, Again.
The Baltic Dry Index (BDIY INDEX) is an indicator published by The Baltic Exchange, in London, first distributed in 1985 and something which gained popularity as a tool for equity investors to “see” the bulk market in the early 2000s.

The index has changed somewhat over the years with the current calculation starting in 2009. It is currently calculated as an average of the Capesize, Panamax, Supramax, and Handysize TimeCharter averages, with a slightly complicated weighting system across a variety of routes. An example for Capesize is in the Appendix (below the Rules & Regulations of the Baltic Coffee House of 1823). Most of the routes have a very heavy weighting to Asia. 75% of the weights of Capesize, Panamax, and Supramax have an Asia or Trans-Pacific end of leg to them (Handysize is 50% Asia end, 50% Europe end).
The increased interest on the part of non-freight customers was because the advent of dramatic increases in raw materials imports to China in the early 2000s meant a significant squeeze on ship time. And because there is seasonality to China and its raw materials imports, more seasonality started showing up in the Baltic Dry Index.
Generically, when raw material pricing goes up because raw material demand goes up, bulker rates go up. When raw material pricing goes up because of natural disaster-induced shortages, the effect can be mixed. For example, if for whatever reason iron ore could not be shipped from Australia to China for a period, shipping costs might rise dramatically (if the materials themselves existed to be exported from elsewhere) simply because of greater ship time to export from say Tubarao to China than from Western Australia to China. Right now, the China-based cost to ship a tonne of iron ore from WA to China is less than US$5 while from Tubarao it is $13. If a serious Brazil export drop were to occur, iron ore would go up in price because of the near-term scarcity, but freight prices might not go up that much because the change in time per tonne required to ship would drop (though they might go up on a scarcity of appropriate ships).
In any case, that China seasonality has another very interesting and over-riding characteristic.
And it has to do with Chinese New Year.
Get Straight to the Source on Smartkarma
Smartkarma supports the world’s leading investors with high-quality, timely, and actionable Insights. Subscribe now for unlimited access, or request a demo below.