In this briefing:
- 2019 Asia Selected Gaming Stock Outlook: Headwinds, Tailwinds and Our Top Picks for Entry Levels Now
- Korean Stock Market Sectors 2018 Review & 2019 Outlook
- Are US Stocks Still Expensive?
- India: Coal Availability Improves at Power Plants, but Utilizations Yet to Pick Up on Lower Demand
- Seven Eleven, Familymart and Lawson Find New Growth Strategies in Tighter Market
1. 2019 Asia Selected Gaming Stock Outlook: Headwinds, Tailwinds and Our Top Picks for Entry Levels Now

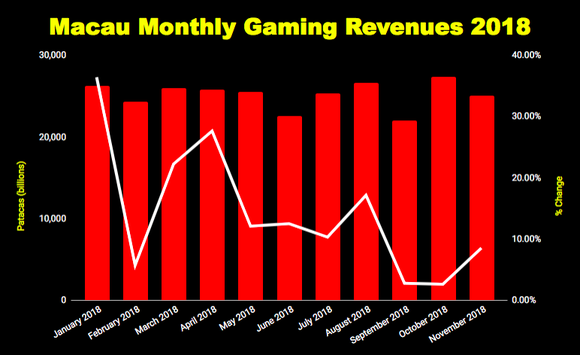
Our review of ten Asian gaming companies forward prospects for 2019 yielded our top five picks. Two of those comprise this insight. Three more will follow in Part Two. There is, in our opinion, some disconnect between continuing macro headwinds in both the VIP and mass sectors and a more bullish tone based on a recent upside trend in Macau, strong results in the Philippines and Cambodia. Given the battering of the market in general, the already 8 month old bearish tone to the sector and the current pricing of the two stocks noted here, we see significant upside opportunity as we near the beginning of 2019.
2. Korean Stock Market Sectors 2018 Review & 2019 Outlook

In this report, we review the major sectors’ performance in the Korean stock market in 2018 and also provide our outlook for them in 2019. We divided the Korean stock market into 17 major sectors such as autos, internet, and utilities. Our top sector picks for 2019 include telecom, Internet/games, utilities, and technology (lithium-ion batteries). We also believe there will likely be select IPOs that could do well next year. Overall, we believe it will be prudent to maintain a defensive position in one’s stock portfolio.
One of the positive surprises that could occur in 2019 could be some kind of resolution between the US-China trade war. Both Xi and Trump have significant incentives to make a truce and negotiate for a settlement. However, even if China and the US make a compromise settlement, we believe the overall positive impact could be temporary. The great concern is the fact that the excessive global debt driven economy may be getting closer to the last legs of the business cycle and as more global investors perceive a global recession ahead, they may accelerate the transition to more defensive portfolios.
The top five stocks we like in the Korean stock market in 2019 are SK Telecom (017670 KS), NCsoft Corp (036570 KS), Samsung Sdi (006400 KS), LG Corp (003550 KS), and Ottogi Corporation (007310 KS) .
3. Are US Stocks Still Expensive?

There are striking parallels between 1929 and 2018.
The 1929 crash put a halt to a nine-year bull run on the market.
Up until October 1929, same as this year, market consensus was that asset prices could only go up from their current level.
As we mentioned in When the Tide Goes Out, Dominoes Fall, a decade of building up excesses meant a painful burst, back 79 years ago: between October of 1929 and September of 1932, eighty-nine percent of the value of stocks was erased and the market didn’t recover to its former peak until 25 years later.
Are we in a similar situation right now?
4. India: Coal Availability Improves at Power Plants, but Utilizations Yet to Pick Up on Lower Demand
In the first half of FY19, there has been a serious shortage of coal in several thermal power plants in India which was affecting as much as 25% of total capacity of power plants in India. However, it has improved considerably now. As per latest Ministry of Power data as on 23rd December 2018 for 124 plants, coal shortage has become zero in pit head plants and there are only 12 plants in non pit-head category with coal shortages. This change is a significant improvement in coal availability situation for power generation sector in India.
However, the utilizations have not gone up that much for power plants on a cumulative basis across the country. The average utilizations (Plant Load Factor or PLF) for overall India generation capacity was 62.6% for April to November 2018 period and this was 62.7% in November indicating no significant improvement. This virtually no improvement in power plants’ utilization could be linked to lesser demand for electricity because of change in weather conditions and also indicates that coal supply situation may not have improved that much.
Nevertheless, this will reduce the pressure from Power Plants and the sector on Coal India Ltd (COAL IN) for more supplies. However, we many not see much change in production and volumes for Coal India Ltd (COAL IN) which has seen a significant decline in recent months. Another implication is that when the overall demand for electricity comes down, the demand in spot market will also be lower accordingly. It is directly relevant for the merchant power companies and Indian Energy Exchange (IEX IN).
5. Seven Eleven, Familymart and Lawson Find New Growth Strategies in Tighter Market

The following is an in-depth review of the big three Japanese convenience store (CVS) players, Seven Eleven (Seven & I Holdings (3382 JP)), Familymart (8028 JP) and Lawson Inc (2651 JP). This follows our review of the Japanese convenience store sector overall, which is best to read first.
The key operational and strategic themes relevant to investors regarding the Big Three in Japan:
- Saturation has encouraged the top three operators to take over the remaining smaller chains while pushing into regions where they have fewer stores.
- All are expanding new forms of retail:
- Seven Eleven and Lawson have launched new e-commerce ventures that make the best use of their existing store networks and could reach national coverage quite soon.
- Diversification: Familymart, in particular, is tying with all manner of partners to try and come up with a hit hybrid format to find new growth.
- While competition from drugstores and discount food retailers is a threat, convenience stores will continue to find new growth from e-commerce, hybrid stores and innovative products.