In this briefing:
- Last Week in Event SPACE: Familymart, Takeda, Harbin Electric, Motherson, Young Poong, NTT
- Sathorn Series M: TMB-Thanachart Courtship
1. Last Week in Event SPACE: Familymart, Takeda, Harbin Electric, Motherson, Young Poong, NTT

Last Week in Event SPACE …
- Bad banker analysis as Familymart Uny Holdings (8028 JP)‘s tender for Don Quijote Holdings (7532 JP) doesn’t even get close to the mark.
- Spooky action at a distance as the whole episode with Takeda Pharmaceutical (4502 JP)/Shire PLC (SHP LN) and index providers is baffling.
- A possible offer for Harbin Electric Co Ltd H (1133 HK) could trigger corporate governance issues.
Motherson Sumi Systems (MSS IN)‘s potential tilt for Leoni AG (LEO GR) is well telescoped and similarly should be well received.
NTT (Nippon Telegraph & Telephone) (9432 JP) has headroom to buy back shares from the government, but going forward there is still more on-market buying to do.
Young Poong Corporation (000670 KS)‘s holding in Korea Zinc Co Ltd (010130 KS) accounts for an eye-watering ~200% of its market cap.
A last-minute lump of coal in the stocking from MYOB Group Ltd (MYO AU)?
- And analysing the trading patterns of 340+ TOPIX inclusions over the past five years.
(This insight covers specific insights & comments involving Stubs, Pairs, Arbitrage, share Classification and Events – or SPACE – in the past week)
M&A – ASIA-PAC
Recapping the original plan: when Familymart Uny Holdings (8028 JP) (“FM”) sold the remaining 60% of UNY to Don Quijote Holdings (7532 JP) (DQ), it entered into an agreement to buy 20+% in DQ, for one of two reasons; 1) a company wants to prove to the employees of a division being sold that they are maintaining a watchful eye over them, or (as is now evident) 2) the buyer wants to gain an equity method affiliate and the income from it (including the placeholder for frontrunner status to future capital events).
- FM launched a Partial Tender Offer at a 20% premium to last in order to buy these shares, and in the MOU to launch the tender offer there was a clause which said that if FM did not reach the full 20%, it had made arrangements to borrow shares in order to get to 20% of the voting rights. And if FM did not manage to get to the full 20%, there was an agreement between DQ which allowed FM to buy shares in the market to get to a 20% (but not larger) position.
- If FM managed to get the shares, it was going to buy from the weak hands. Growth stock managers don’t like selling growth stocks until the growth stops growing. DQ is still growing, and with UNY, DQ may grow faster than previously expected. The upshot is that everyone decided they’d stand pat – FM got nothing in the tender (0.08% of the total desired).
- Shares in DQ could fall because of a lack of hard strategy announced by FM to buy all the shares at a higher price immediately. That shouldn’t be a big worry – it wasn’t going to happen.
- Travis Lundy sees DQ having a performance skew which includes a “cushion of sorts” in the ¥5500-6600/share zone where he would expect FM to acquire shares. He does not see a cushion for the shares of FM, and expects them to be volatile.
(link to Travis’ insight: FamilyMart Tender Offer for Don Quijote Misses The Mark as Mr. Partridge Stands Pat)
Harbin Electric Co Ltd H (1133 HK) (Mkt Cap: $546mn; Liquidity: $0.4mn)
Power generation equipment manufacturer Harbin Electric Co Ltd H (1133 HK) is currently suspended pursuant to Hong Kong’s Codes on Takeovers and Mergers and Share Buy-backs, suggesting a privatisation offer from parent Harbin Electric Corporation (“HEC”) is pending. As HE is PRC incorporated, a privatisation by way of a merger by absorption may be proposed, similar to Advanced Semiconductor Mfg Corp Ltd. (3355 HK) as discussed in ASMC’s Merger By Absorption.
- It is possible this suspension is not in relation to a takeover, but a major sale of assets, for example, from the parent to the sub. This would make sense given the recent share purchase by HEC (completed in January this year), and the fact HE is playing catch-up to Dongfang Electric Corporation (1072 HK) & Shanghai Electric Group Company (2727 HK). Arguably, launching a takeover shortly after subscribing for more shares is unusual. Then again, when the two SOE railway behemoths CNR and CSR merged in 2015, a merger was disputed (at the time) when both were suspended on account of the fact CNR was only listed (on the HK exchange) in 2Q14.
- HE has perennially traded at discount to net cash. As at its last traded price, the discount to net cash (using the 2018 interim figure of HK$12.4bn, or HK$7.27/share) was 65%.
- “Fair” pricing to me would be something like the distribution of net cash to zero then taking over the company on PER. I simply don’t see this happening. And if it doesn’t, the fiduciary duty of independent directors will be tested/scrutinised if they recommend an offer to shareholders at any price less than the net cash/share of the company.
(link to my insight: Harbin Electric Expected To Be Privatised)
Motherson Sumi Systems (MSS IN) (Mkt Cap: $7.7bn; Liquidity: $1.6mn)
Reportedly Motherson has entered merger/acquisition talks with Leoni AG (LEO GR), a leading provider of cables and cable systems for the automotive sector and other industries. Motherson has made four acquisitions so far in this business segment with the latest being PKC in 2017.
- Motherson has always aimed at strengthening this business area internationally, therefore the news about a merger with Leoni comes as no surprise and was mentioned as a potential acquisition target in LightStream Research‘s earlier insight Two More Acquisitions on the Way for Motherson Sumi.
- Motherson has a strong balance sheet that could support this acquisition, although its ability to make further acquisitions in the short-to-medium term may be hampered – Leoni would be at the higher end of the price range for recent acquisitions. Should the acquisition go through, the company will be very well positioned to reach its US$18bn revenue target by 2020E, given that the combined revenue for FY2017 alone is ~US$13bn.
- Currently, Motherson is trading at an FY1 EV/EBITDA of 10x, slightly above peers such as Mahindra Cie Automotive (MACA IN) (9x) and below peers such as Bosch Ltd (BOS IN) (25x). If the deal goes through, Motherson’s FY1 EV/EBITDA of ~12x would be at a slight premium to local players, but still reasonable compared to international players.
(link to Aqila Ali ‘s insight: Motherson In Merger Talks with One of Our Previously Short-Listed Candidates – Leoni)
Kohlberg Kravis Roberts reduced its indicative offer to $3.40 from $3.77 on Thursday after sifting through MYOB’s books, with MYOB announcing:
Following completion of due diligence and finalisation of debt funding commitments, KKR has revised the offer price to $3.40 per share. … The board has informed KKR that it is not in a position to recommend the revised proposal, however it remains in discussions with KKR regarding its proposal. (my emphasis)
- KKR’s revised non-binding proposal expired at 5pm on Friday, which came and went without any ASX announcement. Presumably, an announcement will be made before the market opens tomorrow (rendering this commentary redundant) with either MYOB grudgingly accepting the lower offer, or MYOB rejecting and KKR walking away (for now), or going hostile.
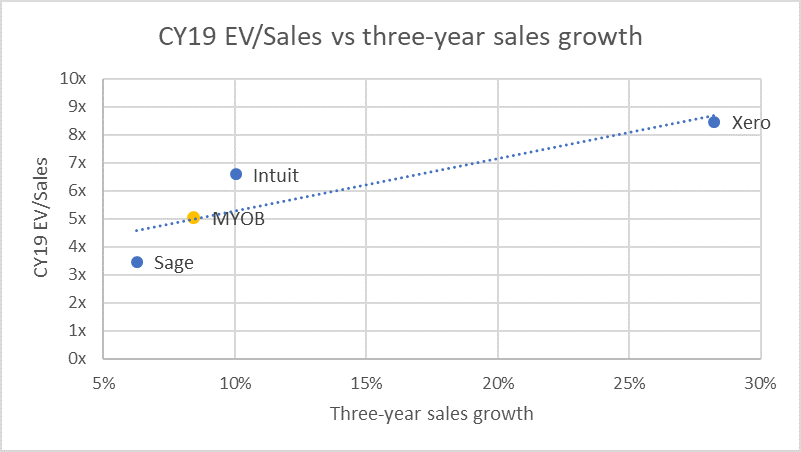
- Since the initial October proposal, MYOB’s peers (Hansen Technologies (HSN AU), Adacel Technologies (ADA AU), Bravura Solutions (BVS AU), Iress Ltd (IRE AU), Technology One (TNE AU), Xero Ltd (XRO AU) and Wisetech Global (WTC AU)) have traded down 17%, on average, while the ASX is down 10%. That backs out a possible adjusted-downside price range of $2.47-$2.68/share. Shares closed at $2.87 on Friday.
(link to my insight: Friday Deadline Looms As MYOB Snubs KKR’s Reduced Offer)
EVENTS
NTT (Nippon Telegraph & Telephone) (9432 JP) (Mkt Cap: $75bn; Liquidity: $181mn)
The Nikkei carried an article noting that the Japanese government’s FY2019 budget currently being formed proposes a sale of ¥160bn of shares in NTT to help fund any revenue impact from the upcoming consumption tax rate hike from 8% to 10% next October. The article helpfully notes that they plan on selling when NTT is buying back shares. One of the longstanding features of buybacks for NTT is that NTT is subject to the NTT Law which requires (for the moment) that the government hold at least one-third of the shares outstanding in NTT.
- Travis estimates NTT has ~1.95bn shares outstanding, or ~1.917bn shares outstanding ex-Treasury shares, after recent buybacks. If NTT cancelled the shares it has bought back prior to buying back shares from the government, this would allow NTT to buy back 59mm shares from the government (assuming those shares are also cancelled). If it did not, it would mean NTT could only buy back about 42-43mm shares. 59mm shares backs out ¥250bn; 43mm shares at a 10% discount would be ¥180bn. That means there is about 10% leeway in stock price to buy ¥160bn from the government IF shares repurchased under the current buyback are not cancelled.
- But that also means that there would be no more buybacks from the government after that until the company buys back more shares from the market. If the company wanted to buy back another ¥200bn from the government, ceteris paribus it would have to buy back something like ¥400-450bn first from the market in order to reduce the denominator. Travis concludes there is still more on-market buying to do.
- At an NTT/ NTT Docomo Inc (9437 JP) ratio of 1.80x, buybacks coming, expected ongoing strong dividend policy (and lots of headroom to do so, unlike perhaps Softbank Corp (9434 JP)), and investor suspicion of what comes next for Docomo, NTT is the home of the cashflow.
(link to Travis’ insight: NTT Buybacks Will Roll On)
Takeda Pharmaceutical (4502 JP) & Softbank Corp (9434 JP)
The IPO of Softbank Corp and the Merger of Takeda and Shire Pharmaceuticals create significant changes in TOPIX, MSCI, and FTSE because of the addition of roughly ¥5tn of “new” market capitalization in major Japan indices. Pure passive investors have something like ¥1.35tn of Softbank Corp and Takeda Pharmaceutical to buy.
- However, after Travis’ initial note (Softbank Corp, Takeda, and Newton’s Three Laws of Motion), TSE unhelpfully changed their mind on timing (for Takeda) based on an unhelpful change by the LSE. With the changes at FTSE and now TOPIX and JPX Nikkei 400, we no longer have quite the same clarity of forces on the bodies, and therefore less clarity on the resulting motion. The LSE’s announced market change appears to have led the MSCI to change its deletion date for Shire as well, now also (along with FTSE) deleting Shire at the close of the 21st. The new schedule is:
Index Deletion Shire
(shs mm)Index Inclusion Takeda
(shs mm)Index Effect
(US$ bn)Net Delta
(US$bn)21 Dec MSCI -50 MSCI JP +75 – $0.3bn +$1.3bn 21 Dec FTSE UK, All-Share, -100-130 FTSE JP +15 -$5.2bn+ – $2.1bn rest of December – end of a pretty bad year for hedge funds, but illiquid
all of January
30 Jan TOPIX -$1.9bn TOPIX, JPXN400 +60
+$2.1bn +$2.1bn 30 Jan TOPIX -$3.5bn TOPIX Softbank +$3.5bn +$3.5bn all of February 27 Feb TOPIX, JPXN400 +60 +$2.1bn +$2.1bn - It doesn’t change the amounts but a lot more time allows for more risk and preparation and there will no longer be any potential settlement issues on the TOPIX side. There is still the same amount of Takeda to buy in TOPIX and JPX Nikkei 400.
- In principle, Travis would want to be long Takeda at the close of the year of 2018, but given the LSE and TSE changes there is less support to give and the payoff is substantially more distant.
links to Travis’ insights
Softbank Corp, Takeda, and Newton’s Three Laws of Motion
Takeda: Move Over Newton! Now It’s Spooky Action At a Distance
Dic Corp (4631 JP) (Mkt Cap: $2.8bn; Liquidity: $15mn)
Speciality steel maker Nisshin Steel (5413 JP) is slated to merge with parent company Nippon Steel & Sumitomo Metal (5401 JP) as of January 1, 2019. For that, Nisshin Steel will be delisted on December 26th (i.e. the last day of trading is the 25th) and that means the Nikkei Inc was obliged to choose a replacement for Nisshin Steel in the Nikkei 225 and other indices. On December 11th, the Nikkei Inc announced Itoham Yonekyu Holdings Inc (2296 JP) would take Nisshin’s place in the Nikkei 500 Index; announced that Japan Post Holdings (6178 JP) would join the Nikkei 300 Index; and announced that Dic Corp (4631 JP) would replace Nisshin Steel in the Nikkei Stock Average, better known as the Nikkei 225.
- Nisshin Steel’s deletion is a nothing-burger.
- The possibility of a DIC addition was well-flagged as early as May when sell-side brokers started compiling Annual and Ad Hoc Review lists for the Nikkei 225 changes to come in September and as a result of the Nisshin Steel merger. Travis would rather be long DIC than short DIC through the close of December 21st or probably December 25th.
(link to Travis’ insight: Small Potatoes Nikkei 225 Changes on Christmas Day)
STUBS/HOLDCOS
Young Poong (000670 KS) / Korea Zinc (010130 KS)
YP appeared “cheap” back in April when I last discussed this Holdco, and is now cheaper, with its holding in KZ accounting for near-on 200% of its market cap. I can’t think of any other parent/subsidiary relationship – one which is essentially a single stock structure – with such a deep discount. Especially one where the stub ops operate in a similar space to that of the listed holding.
- On the negative front, an investigation into YP’s Seokpo zinc smelter remains ongoing on account of perceived environmental transgressions. The Seokpo smelter is located in a national park on the Nakdong river. Wastewater containing above-legal limits of certain chemicals (fluoride and selenium) allegedly flowed downstream to residents, who are heavily reliant on this water.
- YP’s stub and KZ are in the same business, but there are differences. YP does not have a balanced product mix as KZ does, with around 84% of its revenue coming from zinc-related production (for the 9M18 period), compared to 42.5% (on a revenue basis) for KZ, followed by lead (20.4%), silver (20.2%), and gold (7.6%).
- However, YP and KZ remain inextricably intertwined and the current discount is unjustifiably steep. Just that YP’s liquidity, uncertainty on Seokpo, and lack of a near-term catalyst make for a difficult stub set-up.
(link to my insight: StubWorld: Young Poong Blows Out, Again)
Softbank Group (9984 JP) / Softbank Corp (9434 JP)
A forgettable trading debut for Japan’s largest-ever IPO, with Softbank Corp, closing at ¥1,282/share, down from the IPO price of ¥1,500, and closing at ¥1,316/share on Friday, the same day as its FTSE inclusion.
- At around 22% of NAV and 16% of GAV – by my calcs – Corp is a material % of Softbank Group (9984 JP). However as repeatedly seen when a conglomerate adds yet another listco to its stable (in Hong Kong, Wheelock & (20 HK) and Great Eagle Holdings (41 HK) spring to mind), a sustained narrowing in the holdco discount is often not the end result. Nor should it be. Softbank is effectively swapping shares for cash.
- The discount did narrow from the 2Q18 through to early October. Pelham Smithers‘ take on that narrowing is discussed in its insight Why SoftBank’s (9984 JP) Holdco Discount Is Narrowing.
TOPIX INCLUSIONS!
With seven stocks promoted/reassigned from TSE2, MOTHERS, and JASDAQ in November 2018 leading to the same seven stocks being included in TOPIX at the end of December, Travis tested 340+ TOPIX inclusions over the past five years to see what really happens around TOPIX inclusions?
- If you own all but the smallest stocks (with a market cap of less than ¥15bn), odds are that, ON AVERAGE, they will underperform TOPIX from inclusion date or the day after, for many months.
- The larger the market cap, the more marked the AVERAGE underperformance immediately following inclusion.
- For names in the ¥25-50bn sweet spot of “large enough to be “small cap” with somebody paying attention to it”, outperformance vs underperformance in the next 10 days is a 47/53 proposition. That is a bigger risk. It may be data-idiosyncratic, but it is not clear.
- In the case of the 7 names going into TOPIX at month-end this month, the averages would suggest one could still be long the four largest (at the time of Travis’ insight), but one would not want to be long the others; and one could sell long positions in all the names as of the close of the 27th or 28th and have it be an ex-ante expected net positive outcome vs TOPIX over the following 10-60 trading days.
(link to Travis’ insight: Historical TOPIX Inclusions: How Do They Do Around Inclusion Date?)
SHARE CLASSIFICATIONS
Ke Yan, CFA, FRM provided an update on the HK Connect/southbound flow. Fullshare Holdings (607 HK), Shandong Gold Mining Co Ltd (1787 HK) and Shanghai Fosun Pharmaceutical (Group) (2196 HK) rounded out the top three inflows relative to their free float in the past seven days. Shandong Gold remained in the top inflow list for the third consecutive week. Top outflows relative to the free float are Wuxi Biologics (Cayman) Inc (2269 HK), China Southern Airlines (1055 HK) and Sino Biopharmaceutical (1177 HK).
(link to Ke Yan’s insight: Discover HK Connect: Mainlanders Are Buying Shandong Gold, and Pharmaceuticals (2018-12-17))
Briefly …
- CJ Corp (001040 KS) announced both Common and Pref will get 0.15 class B pref shares for each share they already own. This new class B pref is convertible to Common with a 10-year duration, and it provides an extra 2% of the face value to what Common gets. Price ratio wise, 1P is currently close to the 2Y mean. This stock dividend should push 1P up, as should CJ’s announcement it would pay a cash dividend. The current div yield difference is a historic high at 1.53%. (link to Sanghyun Park ‘s insight: CJ Corp Share Class: Huge Net Gain Difference Between Common & Pref from Stock Dividend)
- There are expectations of a ₩500 year-end dividend (up 25% YoY) for Lg Electronics (066570 KS) Common, or a dividend yield of 0.75%. Prefs will get ₩550 or a dividend yield of 2.03%. The yield spread would be 1.28%, the widest since 2015. There may be some narrowing in the spread as we head into year-end. (link to Sanghyun’s insight: LG Electronics Share Class: Long Pref/Short Common on a 4Y High Discount & Div Yield Gap)
OTHER M&A UPDATES
- LCY Chemical Corp (1704 TT). MOEA (Ministry of Economic Affairs) approval has now been received and LCY has applied for the delisting from the TWSE. The last trading day is the 23 Jan 2019 and the stock delists on the 30 Jan. The settlement is expected to take place mid-Feb.
- Healthscope Ltd (HSO AU). In an ASX announcement on Friday Brookfield said: “based on its enquiries and financing discussions to date, it has no reason to believe it will not be willing and able to proceed with the proposal“. The exclusivity provisions have been extended to 18 January. Separately, Healthscope has also received correspondence from the BGH-AustralianSuper Consortium that it has indicated it is able to commence due diligence immediately. HSO’s board stated it will consider the correspondence. These are both positive developments.
CCASS
Often these moves can easily be explained – the placement of new shares, rights issue, movements subsequent to a takeover, amongst others. For those mentioned below, I could not find an obvious reason for the CCASS move.
Name | % change | Into | Out of | Comment |
11.53% | CMBC | China Sec | ||
37.50% | Kingston | Outside CCASS | ||
17.24% | UBS | Outside CCASS |
2. Sathorn Series M: TMB-Thanachart Courtship
Right before Christmas, the Ministry of Finance confirms that both Thanachart and KTB were in talks to merge with TMB. We note that:
- Considering that KTB’s earlier courtship failed once, it is more likely, but by no means guaranteed, for the deal with Thanachart to happen.
- A deal with Thanachart would leave TMB as the acquirer rather than the target. Thanachart’s management has better track record than TMB.
- Both banks have undergone extensive deals before this one: 1) TMB acquired DBS Thai Danu and IFCT; and 2) Thanachart engineered an acquisition of the much bigger, but struggling, SCIB.
- A merger between the two would still leave them smaller than BAY and not really change the bank rankings, but it would give TMB a bigger presence in asset management and hire-purchase finance and an re-entry into the securities business.