After months of skirting around inventory build-up and a weakening demand outlook, Micron used their latest earnings report to call closing time on a revenue and profitability party that began in Q4 2016 and just got better and better with each passing quarter.
Micron reported Q1 FY2019 results on December 18’th and while revenues were largely in line with recently lowered guidance from the company, their outlook for both Q2 and 2019 as a whole was worse than even the most bearish of expectations.
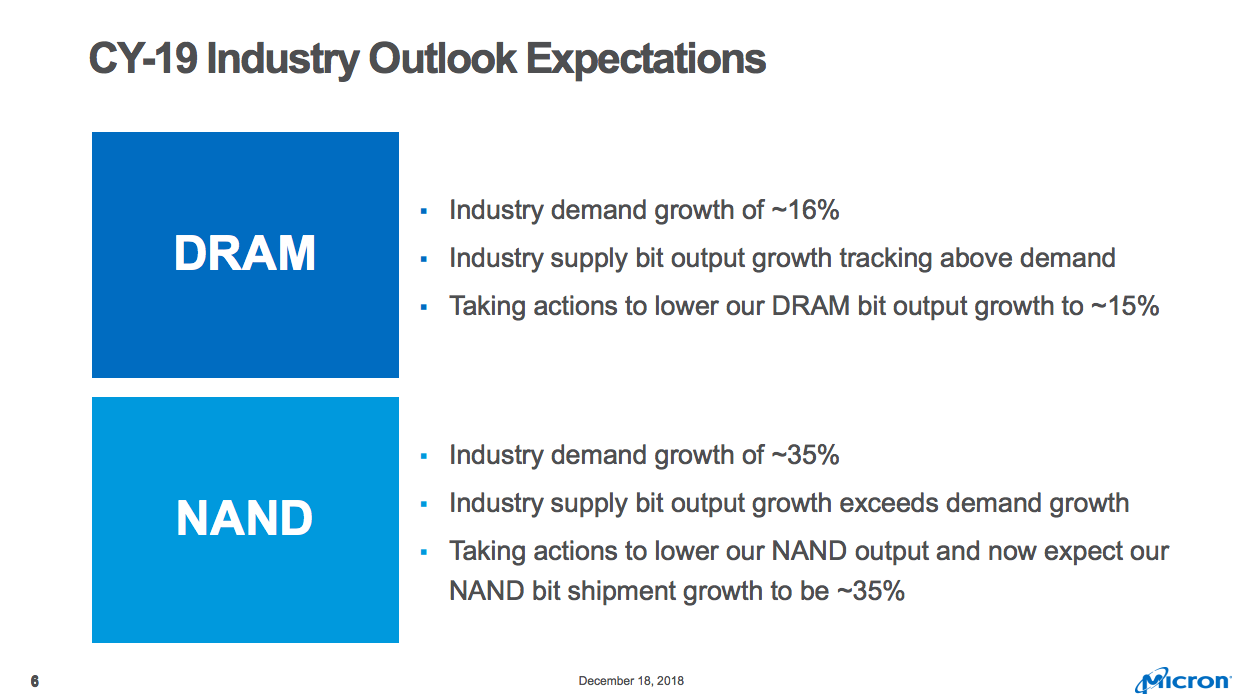
Citing high inventory levels at key customers, Micron guided Q2 FY2019 revenues for $6 billion at the midpoint, down a staggering $1.9 billion, 24% QoQ and 18% YoY. At the same time, Micron revised down their CY2019 bit demand growth forecast for both DRAM (from 20% to 16%) and NAND (35%, the bottom of the previously forecasted range). The company plans to adjust both CapEx and bit supply output downwards to match.
In the wake of their guidance bombshell, Micron’s share price closed down almost 8% the following day to end the session at $31.41, a level last seen in August 2017. Micron is unique in reporting out of sync with its industry peers, making it the proverbial canary in a coal mine. The company’s gloomy outlook and clarion call for further CapEx reductions in a bid to rebalance supply and demand spells troubled times ahead for an already beleaguered semiconductor segment ahead of the upcoming earnings season.
The Indian indices have been seeing an ebb and flow with bearish indicators accounting for market dips with a recovery towards the end of the period. Overall the Indian indices have outperformed the global market this month with positive returns across sectors except for pharma and the metal sector.
If we look more closely at the latest Industrial Production (IIP) increase data which reported a strong overall growth of 8.1% yoy, we find a mixed picture emerging on the component wise contribution and growth across categories. The industry group ‘Manufacture of furniture’ has shown highest positive growth of 41.0% followed by 39.0% in ‘Manufacture of wood and products of wood and cork’, which is not as such the indicators of robust capacity creation for an economy. There are other interesting data points as well. Among top five item groups with positive percentage increase in production, some are purely consumption items which will have rather limited impact in terms of long term positive implications for the country.
But, what is that we are most worried about? For several previous months, IIP growth data is getting massive support from huge growth in electricity consumption. Electricity has contributed the most in growth even in October data (almost 20% more than mining, the second most important contributor and the one which has double the weight as compared to electricity). But, this could also be primarily driven by Government schemes such as SAUBHAGYA and other initiatives for rural electrification which are in overdrive. If this is not managed well, massive growth in electricity could lead to more stress for DISCOMs (power distribution companies) and that could be harmful for the entire power sector.
US: Stocks fall on political turmoil despite positive noises from the Fed with a dovish rate hike, a reduction in expected 2019 hikes and positive trends on employment and inflation.
Russia: Unexpected 25 bps rate hike in the face of higher inflation in Nov. Watch for impact of lower oil prices in coming quarters.
Turkey: Economic developments remain negative. The outlook for retail sales is poor as the economy in general is faltering.
Indonesia: Trade deficit in November. Exports down 3.3%; imports up 11.68%. This disappointing performance could be the beginning of a trend.
Maruti Suzuki’s Q2FY19 results were below our expectations. Sales grew by only 2% YoY in Q2FY19 led by a 3.7% increase in realization per unit. But the volumes declined by 1.5% YoY in the same period. We analyze the results.
Lic Housing Finance (LICHF IN), founded by Life Insurance Corporation of India, is the 2nd largest Housing Finance Company (HFC) in India with a total outstanding loan book portfolio of Rs 1,759 bn as of 2QFY19. 94% of the company’s loans were to retail customers as home loans & Loan Against Properties (LAP) and the balance 6% were to project developers as of 2QFY19.
We like the business of LICHF for following reasons:
LICHF focuses on the salaried segment. 86% of the customers as of 2QFY19 were from the salaried class. This provides the company with stability in earnings and better asset quality. We expect the NIMs & Spreads to be stable at 2.4% & 1.2% respectively for the period of FY18-21E.
We expect LICHF’s total loan book to grow at a CAGR of 16% over the period of FY18-21E. This growth will be supported by LAP and Developer loans. We expect the retail home loan portfolio to grow at a CAGR of 11% over the same period.
As the company focuses on LAP & developer segment to grow the total loan book, we expect this to affect the asset quality adversely. We expect the Gross Non-Performing Assets (GNPA) & Net Non-Performing Assets (NNPA) to increase to 1.3% (from 1.2% as of Sept-18) & 0.5% (from 0.4% as of Sept-18) respectively.
We initiate coverage on LICHF with a fair value estimate of Rs 570/- over the next 12 months. This implies a potential upside of 19% from the closing market price of Rs 481 as on 20th December 2018. This is arrived by applying P/ABV (Price to Adjusted Book Value) multiple of 1.7X to our Adjusted Book Value Estimate of Rs 337 per share for the period ending Sept-20E.
Particulars
FY18
FY19E
FY20E
FY21E
P/ABV (X)
2.1
1.7
1.5
1.3
ROE (%)
17.3
15.5
14.5
15.1
ROA (%)
1.3
1.2
1.2
1.2
Source: Trivikram Consultants Research as of 20th December 2018
The seat sharing formula announced over the weekend by BJP and its partners in Bihar is a clear sign of a more flexible and accommodating BJP leadership (Prime Minister and party president). There are total 40 Lok Sabha seats in Bihar and 17 seats each for two parties (JDU and BJP) which had won 2 (JDU) and 22 (BJP) in the 2014 elections from Bihar is a sign of BJP’s great pragmatism and willingness to concede more space to allies. This is not only required for BJP to deal with a more formidable challenge from Opposition, it is also very important to assuage concerns of allies which are getting more demanding.
This decision of BJP also has larger implications, for pre-elections approach of BJP on contentious issues with its existing and potential allies and also for its ability to attract more parties to NDA post elections. Realizing they are dealing with a more difficult political challenge in 2019, the BJP leadership of Narendra Modi and Amit Shah is now willing to change its previously aggressive operating model. It is both good and bad. Because while this might impact the pace of decision making and make it slower, it will also to a large extent eliminate the risk of policy misadventures such as demonetization.
The silver lining is that previous experience of Atal Bihari Vajpayee era (when in 1998-2004, the BJP was leading the Central Govt with only 182 seats in Lok Sabha) suggests that even coalition Govt can work effectively. The process at the Govt will be more consultation based and robust because BJP will be less combative when weaker, which might help. Some of the recent examples like departure of ex-RBI Governor Urjit Patel have proven that these issues could have disastrous consequences and are extremely damaging for markets and the image of Govt. If that changes and is reformed at the top, it will be positive for building up the right investment climate in the country.
Shaktikanta Das has been appointed as the new governor of India’s central bank. The new appointment comes as a major boost to the economy and has driven a rebound in the financial markets as well as the Indian rupee. The country’s current account deficit remains a major concern, although these recent developments further affirm India’s attractiveness as an investment destination.
After months of skirting around inventory build-up and a weakening demand outlook, Micron used their latest earnings report to call closing time on a revenue and profitability party that began in Q4 2016 and just got better and better with each passing quarter.
Micron reported Q1 FY2019 results on December 18’th and while revenues were largely in line with recently lowered guidance from the company, their outlook for both Q2 and 2019 as a whole was worse than even the most bearish of expectations.
Citing high inventory levels at key customers, Micron guided Q2 FY2019 revenues for $6 billion at the midpoint, down a staggering $1.9 billion, 24% QoQ and 18% YoY. At the same time, Micron revised down their CY2019 bit demand growth forecast for both DRAM (from 20% to 16%) and NAND (35%, the bottom of the previously forecasted range). The company plans to adjust both CapEx and bit supply output downwards to match.
In the wake of their guidance bombshell, Micron’s share price closed down almost 8% the following day to end the session at $31.41, a level last seen in August 2017. Micron is unique in reporting out of sync with its industry peers, making it the proverbial canary in a coal mine. The company’s gloomy outlook and clarion call for further CapEx reductions in a bid to rebalance supply and demand spells troubled times ahead for an already beleaguered semiconductor segment ahead of the upcoming earnings season.
We’ve reviewed 10 companies in the sector. Of those, three are the consensus favorites of our Tokyo based panel of industry, financial and economics observers of the IR initiative over many years.
Based on pachinko alone, the stocks of these companies are fully valued. Based on potential tailwind from a license award within 6 months, they could be vastly undervalued.
Each of the three noted here brings strength to a bid less based on financials than corporate focus, outlook and experience in the field.
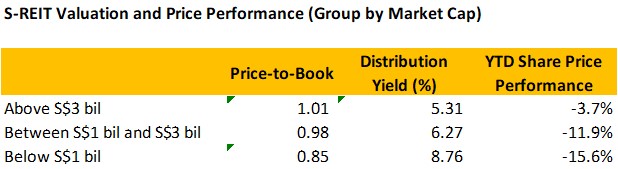
Singapore real estate investment trusts (“S-REITs”) have been one of the best performing sectors on the Singapore stock market in 2018. In view of the surge in selling activities by institutional investors this year, the resilience of the S-REIT sector came as a pleasant surprise to investors. Fundamentals of the S-REIT sector remain strong.
The bigger S-REITs continue to perform well, trading close to their book values and at low yields. The small-cap S-REITs (market capitalization below S$1 bil) tends to be worst performers. Whilst valuation may seem attractive, the low valuations are usually attributable to the additional risk premiums that investors require to compensate for the lack of scale, diversification and growth opportunities as well as the poor track record of some of these S-REITs.
In the coming year 2019, there are 4 investment themes for the S-REIT sector and below are ideas for investors to position their S-REITs portfolio for these themes:
Theme 1: “Safe-haven” asset class for investors
Theme 2: Merger and Acquisition
Theme 3: Growing Overseas Asset Exposure
Theme 4: The Rise of Alternative Property Asset Classes
We’ve reviewed 10 companies in the sector. Of those, three are the consensus favorites of our Tokyo based panel of industry, financial and economics observers of the IR initiative over many years.
Based on pachinko alone, the stocks of these companies are fully valued. Based on potential tailwind from a license award within 6 months, they could be vastly undervalued.
Each of the three noted here brings strength to a bid less based on financials than corporate focus, outlook and experience in the field.
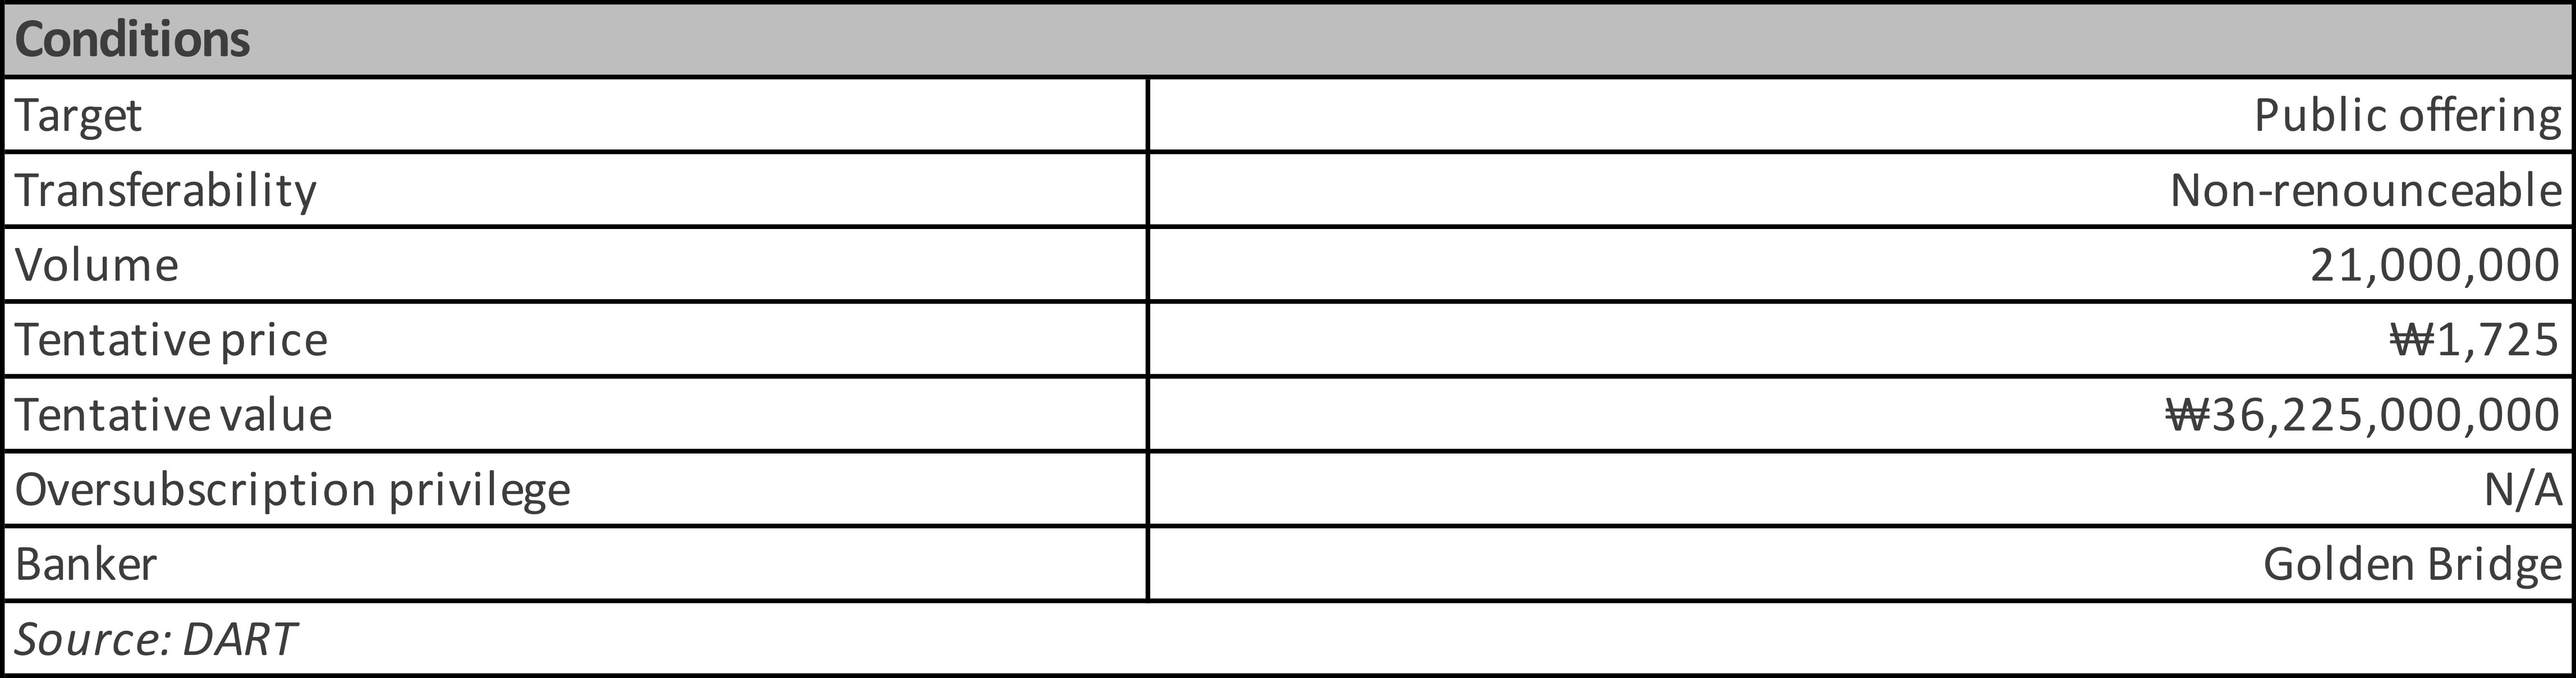
New Pride Corp (900100 KS) announced a ₩36.2bil rights offer. This is a public offering, so there won’t be subscription rights to trade. Pricing will be done as 3-day VWAP on Jan 9~11 at a 30% discount.
Supposedly, we can have ample opportunity to arb trade. This may be what the company is hoping. Simply, we wait until Jan 16~17 (subscription period) and see the spread. At this much discount, there must be a huge spread opening.
Proration risk can be much more annoying than a usual stockholder offering. In the previous public offering event by New Pride, subscription rate went as high as 370 to 1. It should be way much lower this time. But still this is risky enough.
LG Chem Ltd (051910 KS) 1P is now at a 44.20% discount to Common. Div would be the same as last year of ₩6,000 despite lower earnings. Payout would be 28%. Div yield for Common will be 1.68%, and 3.03% for 1P. Div yield difference stands at 1.35%p. This is a record high at least since 2014.
1P’s discount to Common is hovering at the highest level in 2 years. On a 20D MA, it is close to +1 σ. It may not be tempting enough for those seeking high yields. Otherwise, this’d be worth giving it a shot. Liquidity shouldn’t be an issue. Short recovering risk on Common also appears to be limited.
Daelim Industrial (000210 KS) is one of the main targets of local activist movement. This makes a setting for higher dividends. Common div yield to 1.58% and Pref to 4.18%. Difference is 2.59%p. This is the widest gap in many years.
Pref is currently at a 60.89% discount to Common. Among those > ₩100bil MC prefs, it is the second highest discounted pref, only behind CJ Cheiljedang 1P (097955 KS). Local street expects at least ₩1,600 div per share. This should be a conservative estimate. On a 20D MA, Pref is above +1 σ.
Dec 26 is record date of dividend payout. I expect a price catchup movement tomorrow in favor of Pref. I’d go long Pref and short Common as early in the morning as possible.
With the FTSE ST REIT index’s decline of 9.3% year-to-date, value has emerged for some of the bellwether names in the Singapore REITs sector. The forward yield spread between these REITs and the Singapore government 10-year bond yield (2.13%) currently stand at least 390 basis points. In view of the increasing concerns over global economic growth, rising interest rates and the ongoing trade tension between the US and China, I present three quality REITs with fortified portfolios that are well-positioned to weather the near-term market uncertainties. They possess growth potential from acquisitions, positive rental reversions and deliver resilient forward distribution yield of more than 6%. Some of the bellwether names in the more resilient retail REIT sector, while offering lower yield of around 5.0% – 5.7%, are also in my buy list.
The accounting fraud issue had hammered the Celltrion duo nearly equally up until Dec 26. But last two days were different. Healthcare got hurt much more deeply. Celltrion fell only 2.41%, but Healthcare fell 11.52%.
The accounting issue is supposed to be equal to both. KOSPI move and merger are still alive to push up Healthcare. Local institutions and foreigners have bashed both pretty much equally in the last two days. This is another sign that it was more of a price divergence than a mean reversion.
The duo is now at 20D MA and also the yearly mean. I expect it to go substantially below the yearly mean on KOSPI move and merger expectations. A powerful downwardly mean adjusting force still seems to be in action. I’d long Healthcare and short Celltrion to exploit the latest price divergence.
Korean stock market declined again in December. KOSPI was down 2.7% in December and completed 2018 with a decline of 18% this year. Investors remained cautious preferring to increase their capital allocation to defensive sectors such as utilities. However, December was a bit unusual in that KOSPI declined much less than the US market (S&P 500 was down 9% in December). In the past few months, there has been a noticeable outperformance of numerous emerging markets stocks relative to the US stock market.
Fool me once, fool me twice, fool me three times? It has been 10 years since the last Great Repression. Unlike in 2008, when the US Fed Fund rate plummeted from 4.1% in the beginning of the year to 0.09% at the end of the year, the US Fed Fund rate kept climbing throughout the year. The share price declines in global equity markets around the world this year are probably reflecting the concerns about a potential recession in the next two years.
Our model portfolio was down 2.0% in December (cash is 30% of model portfolio), outperforming KOSPI which was down 2.8% in December. Starting January 2019, we are increasing the cash portion to 35% of the model portfolio, to become more defensive in capital allocation.
The top 10 events impacting the Korean stock market, economy, & politics in December were as follows:
Global markets volatility
Growing concerns about the declining memory prices on the semiconductor sector
Investors trying to find next HanjinKal
Hyundai Motor Group and Korean Government’s Big Push into Hydrogen Fuel Cell Vehicles
The year 2018 has proven tumultuous for global markets. Rapidly changing geopolitical priorities of the US, an erstwhile hegemon, have played a role no less significant than the withdrawal of liquidity by leading central banks or US monetary policy tightening. The US has openly declared that it is in a state of “cold war” with China. Despite the recent truce, signs are abundant that the confrontation between the two global superpowers will continue into 2019 and beyond. In 2019, we expect more countries to find themselves in a position where they must choose who they want to side with, the US or China. There are other tectonic shifts, too, which are causing re-alignment of global geopolitical alliances.
Waymo CEO John Krafcik made some bold decisions after taking the helm at Alphabet‘s self-driving project in September 2015. Chief among them was the fact that the company abandon its plans for Level 3 automated driving and focus exclusively on levels 4 & 5. Furthermore, he decreed that Waymo would no longer manufacture its own vehicles but would instead integrate their technology into those of other automakers. Three years later, those decisions would appear to be finally paying off.
On October 10 2018, Waymo reached a significant milestone having completed 10 million self-driving miles across 25 cities in the US. While their first million self-driving miles took 18 months to complete, Waymo now clocks up over a million self-driving miles per month. The company also recently announced the launch of its robo taxi service in Phoenix, Arizona and looks set to quickly follow suit in California. Plans to extend its self-driving technology beyond robotaxis, most notably for trucks and last-mile transportation solutions are also in the works. Furthermore, the company has begun laying down a framework of innovative B2B revenue models which should help accelerate the speed with which they can eventually monetize their technology.
It hasn’t been smooth sailing all the way for Waymo however. Earlier this year, the company was derided for the driving style of its autonomous vehicles and faced the criticism that its driverless cars continue to have safety drivers. There was also an embarrassing incident where one of those very safety drivers caused the self-driving car he was monitoring to hit a motorcyclist when he attempted to take control of the vehicle. According to Waymo’s own analysis of the vehicle log files, the accident would not have happened had he not intervened.
With ten million self-driving miles under their belt and a thoughtful, strategic approach to monetizing their technology beginning to emerge, Waymo remains firmly ahead of their peers in leading the autonomous driving charge.
Halla Holdings is falling nearly 5% today. Holdco said it’d give a ₩2,000 div per share. This is about 4.5% div yield at yesterday’s closing price. 5% drop today shouldn’t be much as an ex-dividend date price drop. Mando fell 5%. Mando was oversold relative to the other local auto stocks, particularly to Halla Holdings. They are still close to +1 σ on a 20D MA.
Mando-Hella Elec has been another reason behind Holdco’s valuation divergence against Mando lately. I believe Mando-Hella is being overhyped. Mando-Hella-caused divergence should no longer be effective. I expect ‘downwardly’ mean reversion from now on. I’d go short Holdco and long Mando at this point.
Chunbo Co Ltd (278280 KS) is a provider of fine chemical materials in Korea, and it is expected to complete its IPO in January 2019. Its chemical materials are used in numerous industries including the display, semiconductors, rechargeable batteries, and pharmaceutical.
The bankers used nine comparable companies, including Sk Materials (036490 KS), Foosung Co Ltd (093370 KS), and Iljin Materials (020150 KS), to value Chunbo Co Ltd (278280 KS). The bankers used the annualized net profit of these companies from 1Q-3Q18 in their valuation analysis. The average P/E multiple of the comps were 25.3x. The bankers then applied Chunbo’s annualized net profit of 19.8 billion won from 1Q18 to 3Q18 and applied the P/E multiple of 25.3x to derive an implied market cap of 501.3 billion won. After applying an IPO discount of 20.2% to 30.2%, the bankers derived an IPO range of 35,000 to 40,000 won.
The company has a consistent record of generating solid growth in sales and profits in the past few years. The company’s sales increased 18.4% CAGR from 2014 to 2017. Its operating margin averaged 21% from 2014 to 3Q18.
Our review of ten Asian gaming companies forward prospects for 2019 yielded our top five picks. Two of those comprise this insight. Three more will follow in Part Two. There is, in our opinion, some disconnect between continuing macro headwinds in both the VIP and mass sectors and a more bullish tone based on a recent upside trend in Macau, strong results in the Philippines and Cambodia. Given the battering of the market in general, the already 8 month old bearish tone to the sector and the current pricing of the two stocks noted here, we see significant upside opportunity as we near the beginning of 2019.
In this report, we review the major sectors’ performance in the Korean stock market in 2018 and also provide our outlook for them in 2019. We divided the Korean stock market into 17 major sectors such as autos, internet, and utilities. Our top sector picks for 2019 include telecom, Internet/games, utilities, and technology (lithium-ion batteries). We also believe there will likely be select IPOs that could do well next year. Overall, we believe it will be prudent to maintain a defensive position in one’s stock portfolio.
One of the positive surprises that could occur in 2019 could be some kind of resolution between the US-China trade war. Both Xi and Trump have significant incentives to make a truce and negotiate for a settlement. However, even if China and the US make a compromise settlement, we believe the overall positive impact could be temporary. The great concern is the fact that the excessive global debt driven economy may be getting closer to the last legs of the business cycle and as more global investors perceive a global recession ahead, they may accelerate the transition to more defensive portfolios.
There are striking parallels between 1929 and 2018.
The 1929 crash put a halt to a nine-year bull run on the market.
Up until October 1929, same as this year, market consensus was that asset prices could only go up from their current level.
As we mentioned in When the Tide Goes Out, Dominoes Fall, a decade of building up excesses meant a painful burst, back 79 years ago: between October of 1929 and September of 1932, eighty-nine percent of the value of stocks was erased and the market didn’t recover to its former peak until 25 years later.
After months of skirting around inventory build-up and a weakening demand outlook, Micron used their latest earnings report to call closing time on a revenue and profitability party that began in Q4 2016 and just got better and better with each passing quarter.
Micron reported Q1 FY2019 results on December 18’th and while revenues were largely in line with recently lowered guidance from the company, their outlook for both Q2 and 2019 as a whole was worse than even the most bearish of expectations.
Citing high inventory levels at key customers, Micron guided Q2 FY2019 revenues for $6 billion at the midpoint, down a staggering $1.9 billion, 24% QoQ and 18% YoY. At the same time, Micron revised down their CY2019 bit demand growth forecast for both DRAM (from 20% to 16%) and NAND (35%, the bottom of the previously forecasted range). The company plans to adjust both CapEx and bit supply output downwards to match.
In the wake of their guidance bombshell, Micron’s share price closed down almost 8% the following day to end the session at $31.41, a level last seen in August 2017. Micron is unique in reporting out of sync with its industry peers, making it the proverbial canary in a coal mine. The company’s gloomy outlook and clarion call for further CapEx reductions in a bid to rebalance supply and demand spells troubled times ahead for an already beleaguered semiconductor segment ahead of the upcoming earnings season.
Recapping the original plan: when Familymart Uny Holdings (8028 JP)(“FM”) sold the remaining 60% of UNY to Don Quijote Holdings (7532 JP) (DQ), it entered into an agreement to buy 20+% in DQ, for one of two reasons; 1) a company wants to prove to the employees of a division being sold that they are maintaining a watchful eye over them, or (as is now evident) 2) the buyer wants to gain an equity method affiliate and the income from it (including the placeholder for frontrunner status to future capital events).
FM launched a Partial Tender Offer at a 20% premium to last in order to buy these shares, and in the MOU to launch the tender offer there was a clause which said that if FM did not reach the full 20%, it had made arrangements to borrow shares in order to get to 20% of the voting rights. And if FM did not manage to get to the full 20%, there was an agreement between DQ which allowed FM to buy shares in the market to get to a 20% (but not larger) position.
If FM managed to get the shares, it was going to buy from the weak hands. Growth stock managers don’t like selling growth stocks until the growth stops growing. DQ is still growing, and with UNY, DQ may grow faster than previously expected. The upshot is that everyone decided they’d stand pat – FM got nothing in the tender (0.08% of the total desired).
Shares in DQ could fall because of a lack of hard strategy announced by FM to buy all the shares at a higher price immediately. That shouldn’t be a big worry – it wasn’t going to happen.
Travis Lundy sees DQ having a performance skew which includes a “cushion of sorts” in the ¥5500-6600/share zone where he would expect FM to acquire shares. He does not see a cushion for the shares of FM, and expects them to be volatile.
It is possible this suspension is not in relation to a takeover, but a major sale of assets, for example, from the parent to the sub. This would make sense given the recent share purchase by HEC (completed in January this year), and the fact HE is playing catch-up to Dongfang Electric Corporation (1072 HK)& Shanghai Electric Group Company (2727 HK). Arguably, launching a takeover shortly after subscribing for more shares is unusual. Then again, when the two SOE railway behemoths CNR and CSR merged in 2015, a merger was disputed (at the time) when both were suspended on account of the fact CNR was only listed (on the HK exchange) in 2Q14.
HE has perennially traded at discount to net cash. As at its last traded price, the discount to net cash (using the 2018 interim figure of HK$12.4bn, or HK$7.27/share) was 65%.
“Fair” pricing to me would be something like the distribution of net cash to zero then taking over the company on PER. I simply don’t see this happening. And if it doesn’t, the fiduciary duty of independent directors will be tested/scrutinised if they recommend an offer to shareholders at any price less than the net cash/share of the company.
Reportedly Motherson has entered merger/acquisition talks withLeoni AG (LEO GR), a leading provider of cables and cable systems for the automotive sector and other industries. Motherson has made four acquisitions so far in this business segment with the latest being PKC in 2017.
Motherson has always aimed at strengthening this business area internationally, therefore the news about a merger with Leoni comes as no surprise and was mentioned as a potential acquisition target in LightStream Research‘s earlier insight Two More Acquisitions on the Way for Motherson Sumi.
Motherson has a strong balance sheet that could support this acquisition, although its ability to make further acquisitions in the short-to-medium term may be hampered – Leoni would be at the higher end of the price range for recent acquisitions. Should the acquisition go through, the company will be very well positioned to reach its US$18bn revenue target by 2020E, given that the combined revenue for FY2017 alone is ~US$13bn.
Currently, Motherson is trading at an FY1 EV/EBITDA of 10x, slightly above peers such as Mahindra Cie Automotive (MACA IN)(9x) and below peers such as Bosch Ltd (BOS IN) (25x). If the deal goes through, Motherson’s FY1 EV/EBITDA of ~12x would be at a slight premium to local players, but still reasonable compared to international players.
Kohlberg Kravis Roberts reduced its indicative offer to $3.40 from $3.77 on Thursday after sifting through MYOB’s books, with MYOB announcing:
Following completion of due diligence and finalisation of debt funding commitments, KKR has revised the offer price to $3.40 per share. … The board has informed KKR that it is not in a position to recommend the revised proposal, however it remains in discussions with KKR regarding its proposal. (my emphasis)
KKR’s revised non-binding proposal expired at 5pm on Friday, which came and went without any ASX announcement. Presumably, an announcement will be made before the market opens tomorrow (rendering this commentary redundant) with either MYOB grudgingly accepting the lower offer, or MYOB rejecting and KKR walking away (for now), or going hostile.
The Nikkei carried an article noting that the Japanese government’s FY2019 budget currently being formed proposes a sale of ¥160bn of shares in NTT to help fund any revenue impact from the upcoming consumption tax rate hike from 8% to 10% next October. The article helpfully notes that they plan on selling when NTT is buying back shares. One of the longstanding features of buybacks for NTT is that NTT is subject to the NTT Law which requires (for the moment) that the government hold at least one-third of the shares outstanding in NTT.
Travis estimates NTT has ~1.95bn shares outstanding, or ~1.917bn shares outstanding ex-Treasury shares, after recent buybacks. If NTT cancelled the shares it has bought back prior to buying back shares from the government, this would allow NTT to buy back 59mm shares from the government (assuming those shares are also cancelled). If it did not, it would mean NTT could only buy back about 42-43mm shares. 59mm shares backs out ¥250bn; 43mm shares at a 10% discount would be ¥180bn. That means there is about 10% leeway in stock price to buy ¥160bn from the government IF shares repurchased under the current buyback are not cancelled.
But that also means that there would be no more buybacks from the government after that until the company buys back more shares from the market. If the company wanted to buy back another ¥200bn from the government, ceteris paribus it would have to buy back something like ¥400-450bn first from the market in order to reduce the denominator. Travis concludes there is still more on-market buying to do.
At an NTT/ NTT Docomo Inc (9437 JP) ratio of 1.80x, buybacks coming, expected ongoing strong dividend policy (and lots of headroom to do so, unlike perhaps Softbank Corp (9434 JP)), and investor suspicion of what comes next for Docomo, NTT is the home of the cashflow.
The IPO of Softbank Corp and the Merger of Takeda and Shire Pharmaceuticals create significant changes in TOPIX, MSCI, and FTSE because of the addition of roughly ¥5tn of “new” market capitalization in major Japan indices. Pure passive investors have something like ¥1.35tn of Softbank Corp and Takeda Pharmaceutical to buy.
However, after Travis’ initial note (Softbank Corp, Takeda, and Newton’s Three Laws of Motion), TSE unhelpfully changed their mind on timing (for Takeda) based on an unhelpful change by the LSE. With the changes at FTSE and now TOPIX and JPX Nikkei 400, we no longer have quite the same clarity of forces on the bodies, and therefore less clarity on the resulting motion. The LSE’s announced market change appears to have led the MSCI to change its deletion date for Shire as well, now also (along with FTSE) deleting Shire at the close of the 21st. The new schedule is:
Index Deletion
Shire (shs mm)
Index Inclusion
Takeda (shs mm)
Index Effect (US$ bn)
Net Delta (US$bn)
21 Dec
MSCI
-50
MSCI JP
+75
– $0.3bn
+$1.3bn
21 Dec
FTSE UK, All-Share,
-100-130
FTSE JP
+15
-$5.2bn+
– $2.1bn
rest of December – end of a pretty bad year for hedge funds, but illiquid
all of January
30 Jan
TOPIX
-$1.9bn
TOPIX, JPXN400
+60
+$2.1bn
+$2.1bn
30 Jan
TOPIX
-$3.5bn
TOPIX
Softbank
+$3.5bn
+$3.5bn
all of February
27 Feb
TOPIX, JPXN400
+60
+$2.1bn
+$2.1bn
It doesn’t change the amounts but a lot more time allows for more risk and preparation and there will no longer be any potential settlement issues on the TOPIX side. There is still the same amount of Takeda to buy in TOPIX and JPX Nikkei 400.
In principle, Travis would want to be long Takeda at the close of the year of 2018, but given the LSE and TSE changes there is less support to give and the payoff is substantially more distant.
Speciality steel maker Nisshin Steel (5413 JP)is slated to merge with parent company Nippon Steel & Sumitomo Metal (5401 JP)as of January 1, 2019. For that, Nisshin Steel will be delisted on December 26th (i.e. the last day of trading is the 25th) and that means the Nikkei Inc was obliged to choose a replacement for Nisshin Steel in the Nikkei 225 and other indices. On December 11th, the Nikkei Inc announcedItoham Yonekyu Holdings Inc (2296 JP) would take Nisshin’s place in the Nikkei 500 Index; announced that Japan Post Holdings (6178 JP) would join the Nikkei 300 Index; and announced thatDic Corp (4631 JP)would replace Nisshin Steel in the Nikkei Stock Average, better known as the Nikkei 225.
Nisshin Steel’s deletion is a nothing-burger.
The possibility of a DIC addition was well-flagged as early as May when sell-side brokers started compiling Annual and Ad Hoc Review lists for the Nikkei 225 changes to come in September and as a result of the Nisshin Steel merger. Travis would rather be long DIC than short DIC through the close of December 21st or probably December 25th.
YP appeared “cheap” back in April when I last discussed this Holdco, and is now cheaper, with its holding in KZ accounting for near-on 200% of its market cap. I can’t think of any other parent/subsidiary relationship – one which is essentially a single stock structure – with such a deep discount. Especially one where the stub ops operate in a similar space to that of the listed holding.
On the negative front, an investigation into YP’s Seokpo zinc smelter remains ongoing on account of perceived environmental transgressions. The Seokpo smelter is located in a national park on the Nakdong river. Wastewater containing above-legal limits of certain chemicals (fluoride and selenium) allegedly flowed downstream to residents, who are heavily reliant on this water.
YP’s stub and KZ are in the same business, but there are differences. YP does not have a balanced product mix as KZ does, with around 84% of its revenue coming from zinc-related production (for the 9M18 period), compared to 42.5% (on a revenue basis) for KZ, followed by lead (20.4%), silver (20.2%), and gold (7.6%).
However, YP and KZ remain inextricably intertwined and the current discount is unjustifiably steep. Just that YP’s liquidity, uncertainty on Seokpo, and lack of a near-term catalyst make for a difficult stub set-up.
A forgettable trading debut for Japan’s largest-ever IPO, with Softbank Corp,closing at ¥1,282/share, down from the IPO price of ¥1,500, and closing at ¥1,316/share on Friday, the same day as its FTSE inclusion.
At around 22% of NAV and 16% of GAV – by my calcs – Corp is a material % of Softbank Group (9984 JP). However as repeatedly seen when a conglomerate adds yet another listco to its stable (in Hong Kong, Wheelock & (20 HK)and Great Eagle Holdings (41 HK) spring to mind), a sustained narrowing in the holdco discount is often not the end result. Nor should it be. Softbank is effectively swapping shares for cash.
With seven stocks promoted/reassigned from TSE2, MOTHERS, and JASDAQ in November 2018 leading to the same seven stocks being included in TOPIX at the end of December, Travis tested 340+ TOPIX inclusions over the past five years to see what really happens around TOPIX inclusions?
If you own all but the smallest stocks (with a market cap of less than ¥15bn), odds are that, ON AVERAGE, they will underperform TOPIX from inclusion date or the day after, for many months.
The larger the market cap, the more marked the AVERAGE underperformance immediately following inclusion.
For names in the ¥25-50bn sweet spot of “large enough to be “small cap” with somebody paying attention to it”, outperformance vs underperformance in the next 10 days is a 47/53 proposition. That is a bigger risk. It may be data-idiosyncratic, but it is not clear.
In the case of the 7 names going into TOPIX at month-end this month, the averages would suggest one could still be long the four largest (at the time of Travis’ insight), but one would not want to be long the others; and one could sell long positions in all the names as of the close of the 27th or 28th and have it be an ex-ante expected net positive outcome vs TOPIX over the following 10-60 trading days.
CJ Corp (001040 KS) announced both Common and Pref will get 0.15 class B pref shares for each share they already own. This new class B pref is convertible to Common with a 10-year duration, and it provides an extra 2% of the face value to what Common gets. Price ratio wise, 1P is currently close to the 2Y mean. This stock dividend should push 1P up, as should CJ’s announcement it would pay a cash dividend. The current div yield difference is a historic high at 1.53%. (link to Sanghyun Park ‘s insight: CJ Corp Share Class: Huge Net Gain Difference Between Common & Pref from Stock Dividend)
LCY Chemical Corp (1704 TT). MOEA (Ministry of Economic Affairs) approval has now been received and LCY has applied for the delisting from the TWSE. The last trading day is the 23 Jan 2019 and the stock delists on the 30 Jan. The settlement is expected to take place mid-Feb.
Healthscope Ltd (HSO AU). In an ASX announcement on Friday Brookfield said: “based on its enquiries and financing discussions to date, it has no reason to believe it will not be willing and able to proceed with the proposal“. The exclusivity provisions have been extended to 18 January. Separately, Healthscope has also received correspondence from the BGH-AustralianSuper Consortium that it has indicated it is able to commence due diligence immediately. HSO’s board stated it will consider the correspondence. These are both positive developments.
CCASS
My ongoing series flags large moves (~10%) in CCASS holdings over the past week or so, moves which are often outside normal market transactions. These may be indicative of share pledges. Or potential takeovers. Or simply help understand volume swings.
Often these moves can easily be explained – the placement of new shares, rights issue, movements subsequent to a takeover, amongst others. For those mentioned below, I could not find an obvious reason for the CCASS move.
CJ Corp (001040 KS) announced a 0.15 stock dividend. CJ will issue a new class B pref. Both Common and Pref will get 0.15 class B pref shares for each share they already own. This new class B pref is convertible to Common with a 10 year duration. It gives an extra 2% of the face value to what Common gets. A total 4,226,513 new class B prefs will be issued.
CJ previously had two class B prefs. Based on the historic discount % of these two, 2P’s discount to Common on the listing day is estimated at 33%. There will be nearly 10% price dilution in both Common and 1P. There will be a 10+%p difference in gain per share. 1P’s dilution-adjusted net gain per share stands at 13.61%, whereas Common is only 0.66%.
Price ratio wise, 1P is in an undervalued territory. On a longer horizon, it is currently close to the 2Y mean. This stock dividend should push 1P further upward above the 2Y mean. CJ also said that it would give cash dividend. Current div yield difference is a historic high at 1.53%p. This should be another reason to push up 1P. I’d go long 1P and short Common at this point.
US: Stocks fall on political turmoil despite positive noises from the Fed with a dovish rate hike, a reduction in expected 2019 hikes and positive trends on employment and inflation.
Russia: Unexpected 25 bps rate hike in the face of higher inflation in Nov. Watch for impact of lower oil prices in coming quarters.
Turkey: Economic developments remain negative. The outlook for retail sales is poor as the economy in general is faltering.
Indonesia: Trade deficit in November. Exports down 3.3%; imports up 11.68%. This disappointing performance could be the beginning of a trend.
With the FTSE ST REIT index’s decline of 9.3% year-to-date, value has emerged for some of the bellwether names in the Singapore REITs sector. The forward yield spread between these REITs and the Singapore government 10-year bond yield (2.13%) currently stand at least 390 basis points. In view of the increasing concerns over global economic growth, rising interest rates and the ongoing trade tension between the US and China, I present three quality REITs with fortified portfolios that are well-positioned to weather the near-term market uncertainties. They possess growth potential from acquisitions, positive rental reversions and deliver resilient forward distribution yield of more than 6%. Some of the bellwether names in the more resilient retail REIT sector, while offering lower yield of around 5.0% – 5.7%, are also in my buy list.
After months of skirting around inventory build-up and a weakening demand outlook, Micron used their latest earnings report to call closing time on a revenue and profitability party that began in Q4 2016 and just got better and better with each passing quarter.
Micron reported Q1 FY2019 results on December 18’th and while revenues were largely in line with recently lowered guidance from the company, their outlook for both Q2 and 2019 as a whole was worse than even the most bearish of expectations.
Citing high inventory levels at key customers, Micron guided Q2 FY2019 revenues for $6 billion at the midpoint, down a staggering $1.9 billion, 24% QoQ and 18% YoY. At the same time, Micron revised down their CY2019 bit demand growth forecast for both DRAM (from 20% to 16%) and NAND (35%, the bottom of the previously forecasted range). The company plans to adjust both CapEx and bit supply output downwards to match.
In the wake of their guidance bombshell, Micron’s share price closed down almost 8% the following day to end the session at $31.41, a level last seen in August 2017. Micron is unique in reporting out of sync with its industry peers, making it the proverbial canary in a coal mine. The company’s gloomy outlook and clarion call for further CapEx reductions in a bid to rebalance supply and demand spells troubled times ahead for an already beleaguered semiconductor segment ahead of the upcoming earnings season.
Tracking Traffic/Chinese Express & Logistics is the hub for our research on China’s express parcels and logistics sectors. Tracking Traffic/Chinese Express & Logistics features analysis of monthly Chinese express and logistics data, notes from our conversations with industry players, and links to company and thematic notes.
This month’s issue covers the following topics:
November express parcel pricing remained weak. Average pricing per express parcel fell by 7.8% Y/Y to just 11.06 RMB per piece. November’s average price represents a new all-time low for the industry, and November’s Y/Y decline was the steepest monthly decline in over two years (excluding Lunar New Year months, which tend to be distorted by the timing of the holiday).
Express parcel revenue growth dipped below 15% last month. Weak per-parcel pricing pulled express sector Y/Y revenue growth down to just 14.6% in November, the worst on record (again excluding distorted Lunar New Year comparisons). Chinese e-commerce demand has slowed and we suspect ‘O2O’ initiatives, under which online purchases are fulfilled via local stores, are also undermining express demand growth.
Intra-city pricing (ie, local delivery) remains firm relative to inter-city. Relative to weak inter-city express pricing (where ZTO Express (ZTO US) and the other listed express companies compete), pricing for local, intra-city express deliveries remained firm. In the first 11 months of 2018, express pricing rose 1.7% Y/Y versus a -2.9% decline in inter-city shipments (international pricing fell sharply, -14.5% Y/Y). Relatively firm pricing on local shipments may make it hard for local food delivery companies like Meituan Dianping (3690 HK) and Alibaba Group Holding (BABA US) ‘s ele.me to beat down unit operating costs.
Underlying domestic transport demand held up well again in November. Although demand for speedy, relatively expensive express service (and air freight) appears to be moderating, demand for rail and highway freight transport has held up well. The relative strength of rail and water transport (slow, cheap, industry-facing) versus express and air freight (fast, expensive, consumer-oriented) suggests a couple of things: a) upstream industrial activity is stronger than downstream retail activity and b) the people in charge of paying freight are shifting to cheaper modes of transport when possible.
We retain a negative view of China’s express industry’s fundamentals: demand growth is slowing and pricing appears to be falling faster than costs can be cut. Overall domestic transportation demand, however, remains solid and shows no signs of slowing.
After high-speed climb, bike-share giant collapses
A brighter new year for China’s stock market?
In my weekly digest China News That Matters, I will give you selected summaries, sourced from a variety of local Chinese-language and international news outlets, and highlight why I think the news is significant. These posts are meant to neither be bullish nor bearish, but help you separate the signal from the noise.