In this briefing:
- Hyosung Holdings: 10%p Drop in Discount to NAV Should Be Reverted Soon
- Last Week in Event SPACE: Harbin Electric, MYOB, TMB Bank, Halla Holdings
- Hotel Properties Ltd– Dissolution of Wheelock-OBS Partnership Could Pave Way for Privatization Offer
- Prabhat Dairy Ltd – Update: Revenues and Margins Continues to Increase in Line with Our Expectations
- Swaraj Engines: Positive Outlook But Growth Is Slowing and Valuation Is Rich
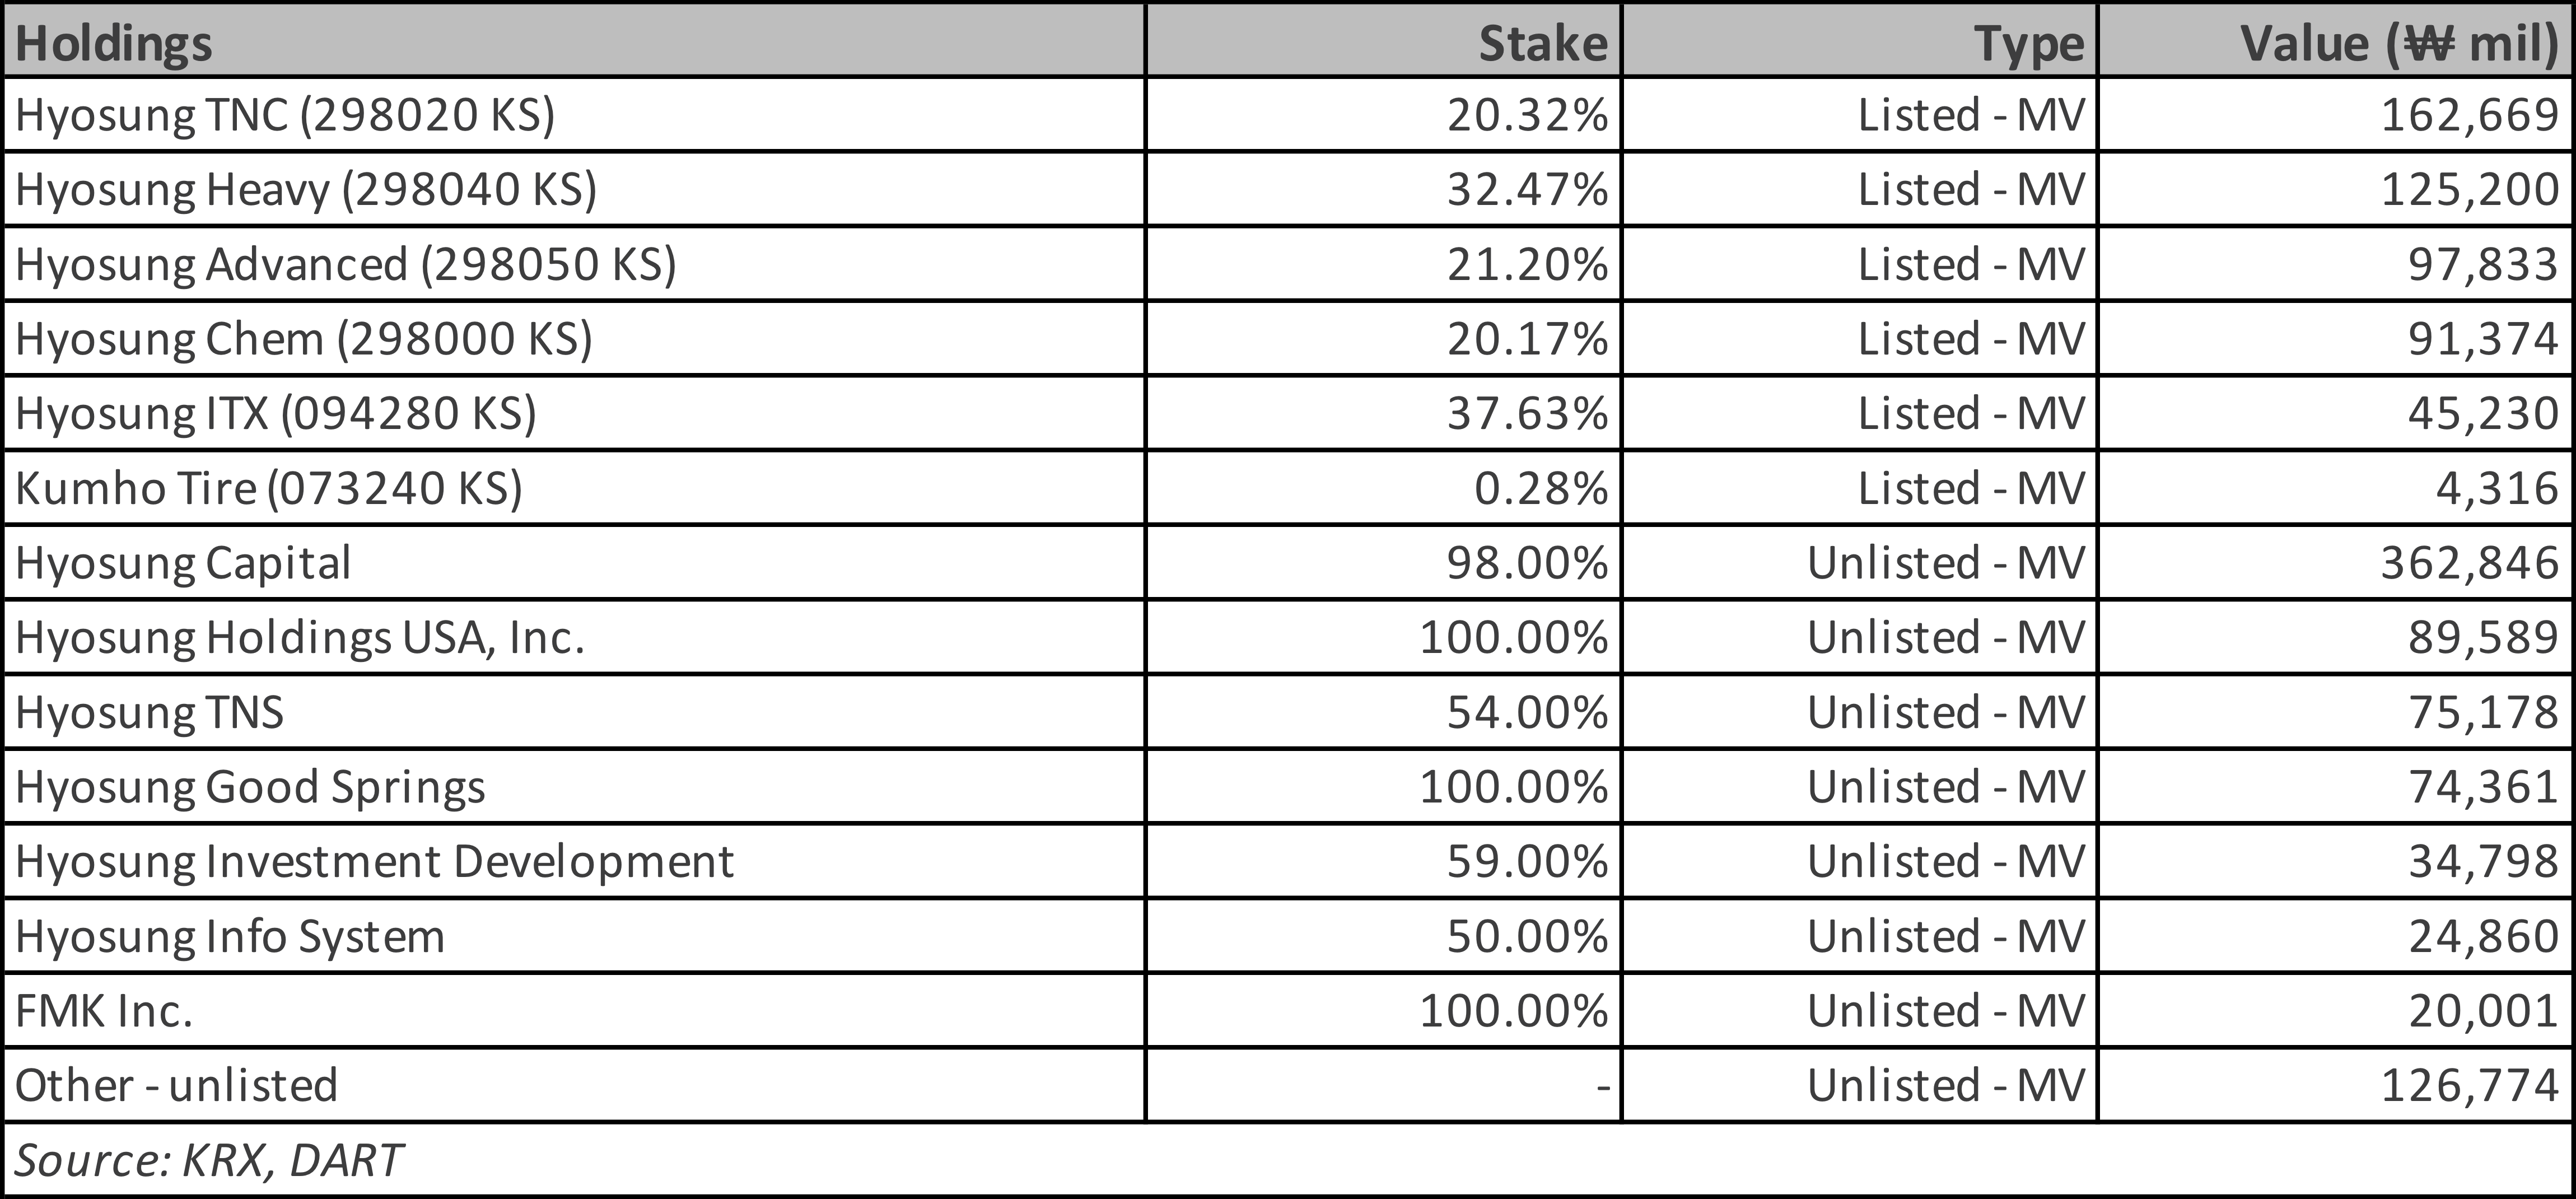
1. Hyosung Holdings: 10%p Drop in Discount to NAV Should Be Reverted Soon

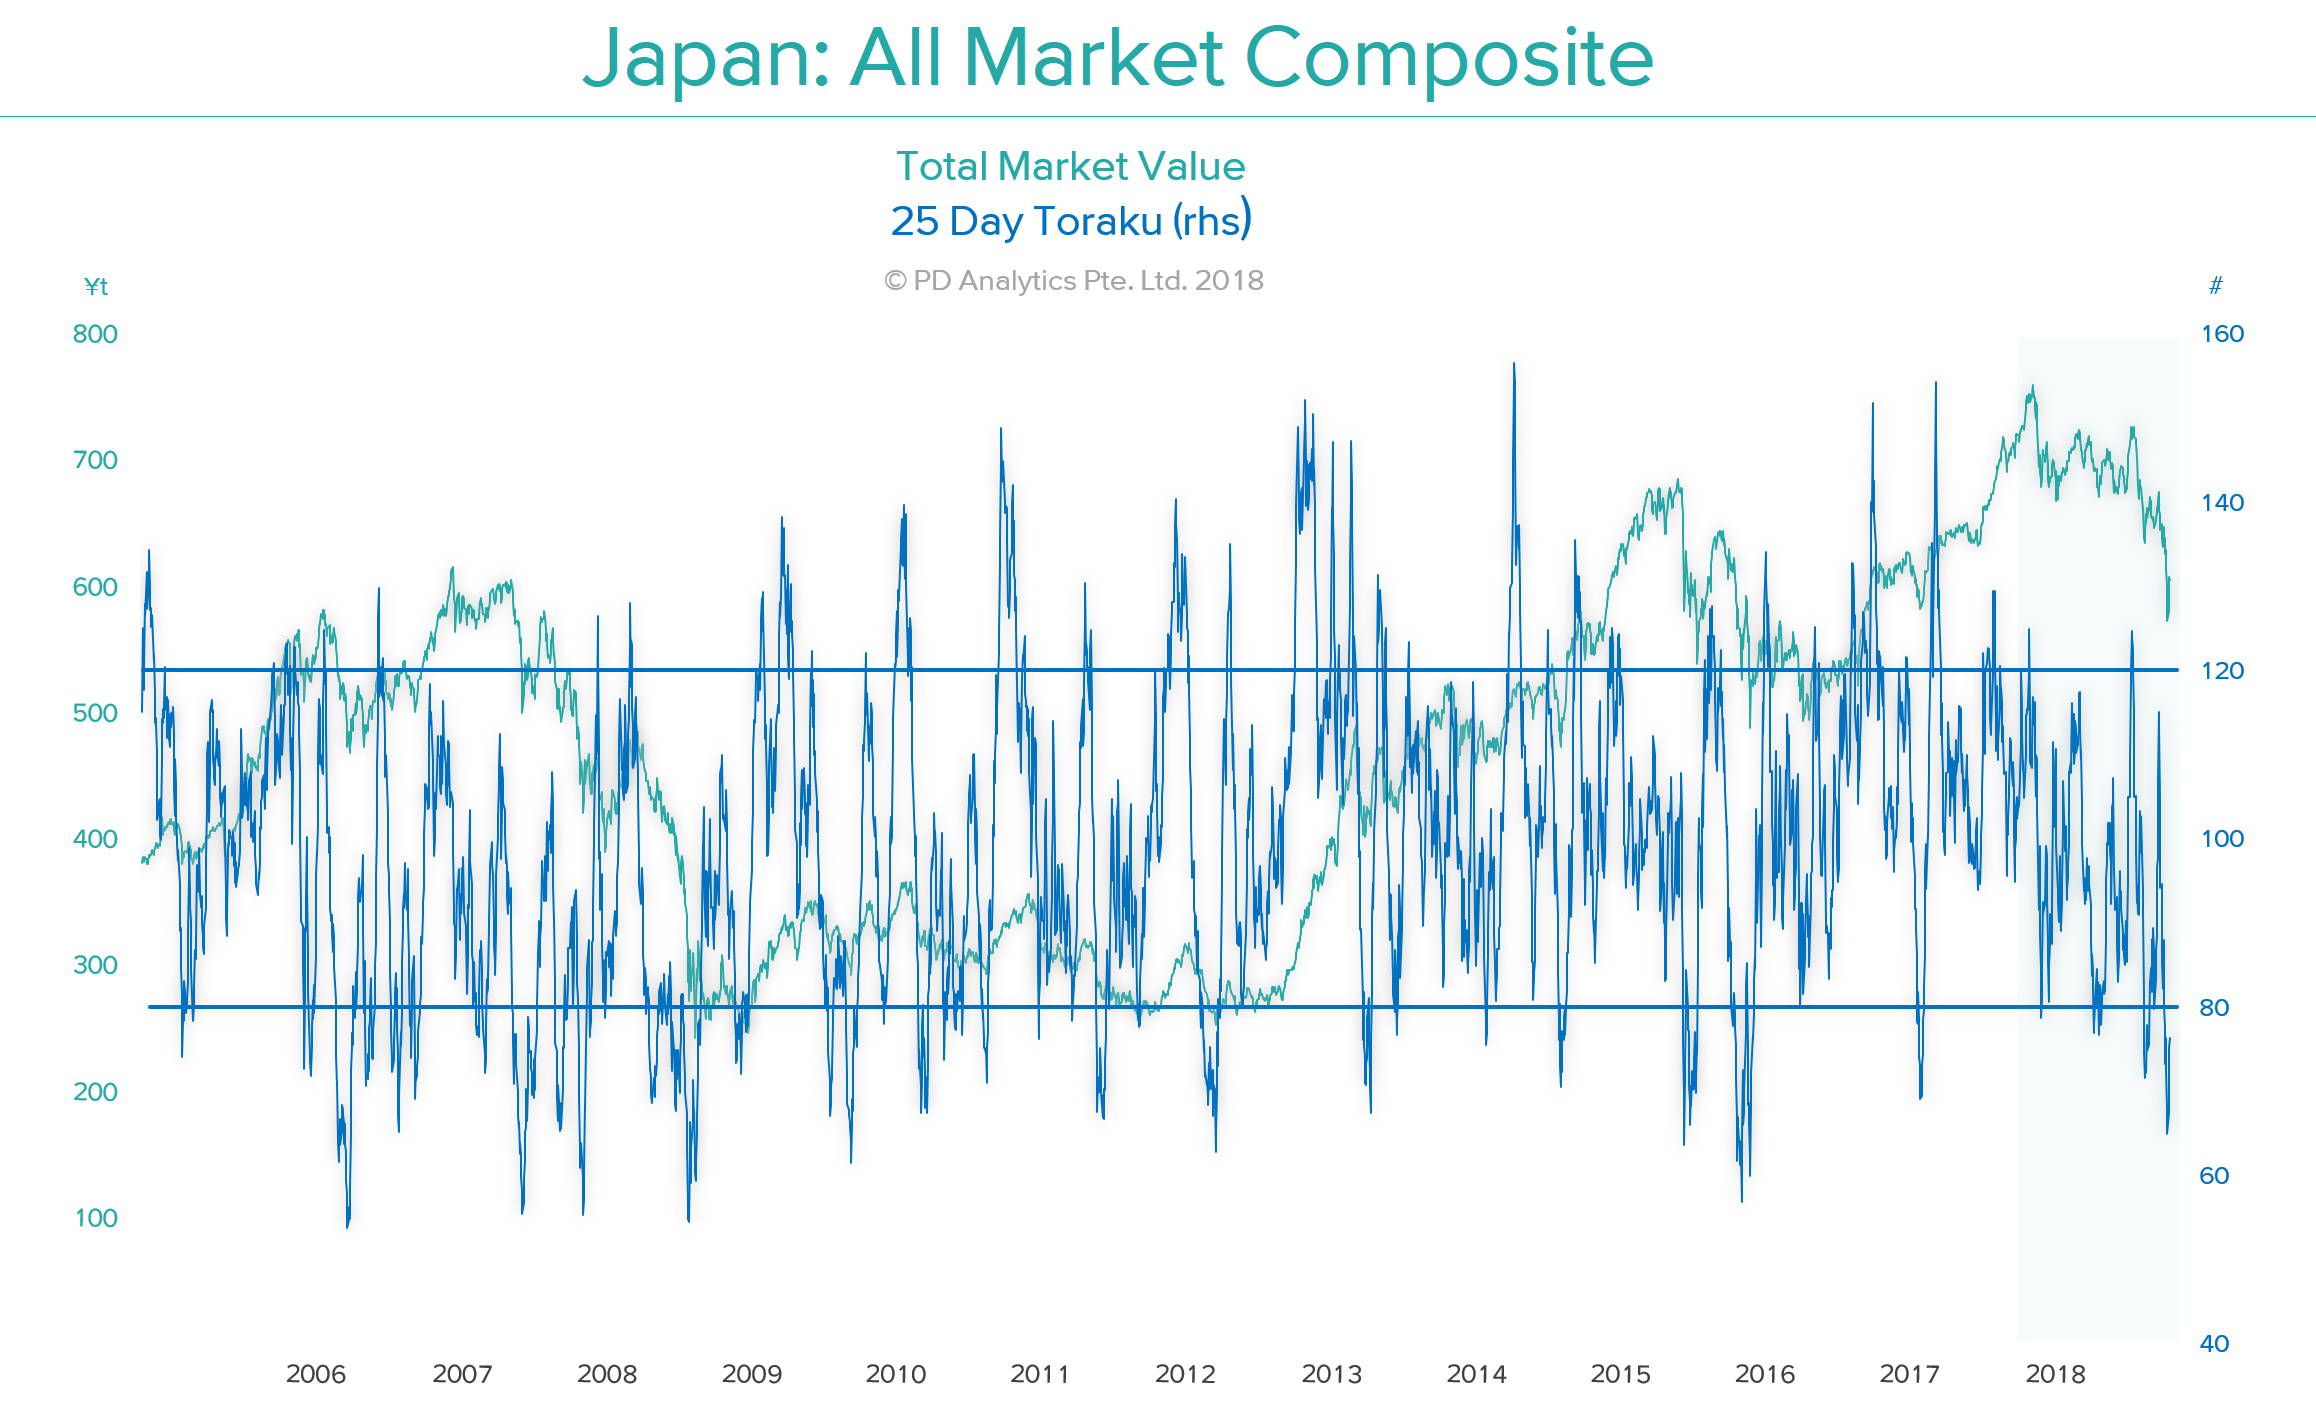
- Hyosung Corporation (004800 KS) had fallen 16% just in two days. Holdco is now at a 50% discount to NAV. This is a 10%p drop from 10 days ago (Dec 19). Holdco price must have been overly corrected. The ongoing police investigation on Cho Hyun-joon’s alleged crime won’t lead to a delisting. 10%p drop in discount to NAV must be a price divergence, not a sensible price correction.
- Trade volume remained steady. Local hedge funds led the selling on Dec 27. Even they changed their position the following day. No short selling spike has been seen either. Hyosung is one of the highest yielding div holdco stocks. Hyosung Capital liquidation and Anyang Plant revaluation would be another short-term plus.
- I’d exploit this price divergence. It would soon revert to the Dec 19 discount level. It should at least stay at the peer average.
2. Last Week in Event SPACE: Harbin Electric, MYOB, TMB Bank, Halla Holdings

Last Week in Event SPACE …
- Just how will Harbin Electric Co Ltd H (1133 HK)‘s independent directors justify recommending an Offer to shareholders at a price which gave cash less cavalier than cash?
- MYOB Group Ltd (MYO AU)‘s directors grudgingly yet understandably enter an agreed deal with KKR.
- A TMB Bank PCL (TMB TB) / Thanachart Capital (TCAP TB) courtship is a possibility after an earlier Krung Thai Bank Pub (KTB TB) /TMB alliance failed.
(This insight covers specific insights & comments involving Stubs, Pairs, Arbitrage, share Classification and Events – or SPACE – in the past week)
M&A – ASIA-PAC
As previously discussed in Harbin Electric Expected To Be Privatised, Harbin Electric (HE) has now announced a privatisation Offer from parent and 60.41%-shareholder Harbin Electric Corporation (“HEC”) by way of a merger by absorption. The Offer price of $4.56/share, an 82.4% premium to last close, is bang in line with that paid by HEC in January this year for new domestic shares. The Offer price has been declared final.
- Of note, the Offer price is a 37% discount to HE’s net cash of $7.27/share as at 30 June 2018. Should the privatisation be successful, this Offer will cost HEC ~HK$3.08bn, following which it can pocket the remaining net cash of $9.3bn PLUS the power generation equipment manufacturer business thrown in for free.
- On pricing, “fair” to me would be something like the distribution of net cash to zero then taking over the company on a PER with respect to peers. That is not happening. It will be difficult to see how independent directors (and the IFA) can justify recommending an Offer to shareholders at any price below the net cash/share, especially when the underlying business is profit-generating.
- Dissension rights are available, however, there is no administrative guidance on the substantive as well as procedural rules as to how the “fair price” will be determined under PRC and HK Law.
- Trading at a gross/annualised spread of 15%/28% assuming end-July completion, based on the average timeline for merger by absorption precedents. As HEC is only waiting for approval from independent H-shareholders suggests this transaction may complete earlier than precedents.
(link to my insight: Harbin Electric: The Price Is Not Right)
KKR and MYOB entered into Scheme Implementation Agreement (SIA) at $3.40/share, valuing MYOB, on a market cap basis, at A$2bn. MYOB’s board unanimously recommends shareholders to vote in favour of the Offer, in the absence of a superior proposal. The Offer price assumes no full-year dividend is paid.
- On balance, MYOB’s board has made the right decision to accept KKR’s reduced Offer. The argument that MYOB is a “known turnaround story” is challenged as cloud-based accounting software providers Xero Ltd (XRO AU) and Intuit Inc (INTU US) grab market share. This is also reflected in MYOB’s forecast 7% revenue growth in FY18 and follows a 10% decline in first-half profit, despite a 61% jump in online subscribers.
- And there is justification for KKR’s lowering the Offer price: the ASX is down 10% since KKR’s initial tilt, the ASX technology index is off by ~14%, a basket of listed Aussie peers are down 17%, while Xero, the most comparable peer, is down ~20%. The Scheme Offer is at a ~27% premium to the estimated adjusted (for the ASX index) downside price of $2.68/share.
Bain was okay selling at $3.15/share to KKR and will be fine selling its remaining ~6.5% stake at $3.40. Presumably, MYOB sounded out the other major shareholders such as Fidelity, Yarra Funds Management, Vanguard etc as to their read on the revised $3.40 offer, before agreeing to the SIA with KKR.
If the markets avoid further declines, this deal will probably get up. If the markets rebound, the outcome is less assured. This Tuesday marks the beginning of a new year and a renewed mandate for investors to take risk, especially an agreed deal; but the current 5.3% annualised spread is tight.
(link to my insight: MYOB Caves And Agrees To KKR’s Reduced Offer)
TMB Bank PCL (TMB TB) (Mkt Cap: $1.2bn; Liquidity: $7mn)
The Ministry of Finance, the major shareholder of TMB, confirmed that both Krung Thai Bank Pub (KTB TB) and Thanachart Capital (TCAP TB) had engaged in merger talks with TMB. Considering an earlier KTB/TMB courtship failed, it is more likely, but by no means guaranteed, that the deal with Thanachart will happen. Bloomberg is also reporting that Thanachart and TMB want to do a deal before the next elections, which is less than two months away.
- TMB is much bigger than Thanachart and therefore it may boil down to whether TMB wants to be the target or acquirer. In Athaporn Arayasantiparb, CFA‘s view, a deal with Thanachart would leave TMB as the acquirer rather than the target. But Thanachart’s management has a better track record than TMB.
- Both banks have undergone extensive deals before this one: 1) TMB acquired DBS Thai Danu and IFCT; and 2) Thanachart engineered an acquisition of the much bigger, but struggling, SCIB.
- A merger between the two would still leave them smaller than Bank Of Ayudhya (BAY TB) and would not change the bank rankings; but it would give TMB a bigger presence in asset management, hire-purchase finance and a re-entry into the securities business.
(link to Athaporn’s insight: Sathorn Series M: TMB-Thanachart Courtship)
STUBS/HOLDCOS
Halla Holdings (060980 KS) / Mando Corp (204320 KS)
Mando accounts for 45% of Halla’s NAV, which is currently trading at a 50% discount. Sanghyun Park believes the recent narrowing in the discount may be due to the hype attached to Mando-Hella Elec, which he believes is overdone; and recommends a short Holdco and long Mando. Using Sanghyun’s figures, I see the discount to NAV at 51%, 2STD above the 12-month average of ~47%.
(link to Sanghyun’s insight: Halla Holdings Stub Trade: Downwardly Mean Reversion in Favor of Mando)
SHARE CLASSIFICATIONS
- LG Chem Ltd (051910 KS)‘s 1P is now at a 44.20% discount to Common. The dividend will be the same as last year of ₩6,000 despite lower earnings. The dividend yield for Common will be 1.68%, and 3.03% for 1P or a dividend yield difference of 1.35%, a four-year high. (link to Sanghyun’s insight: LG Chem Share Class: Another Pref to Watch as Div Yield Gap at 4Y High)
OTHER M&A UPDATES
Glow Energy Pcl (GLOW TB). In a strange twist to the tale, the ERC agrees to approve Global Power Synergy Company Ltd (GPSC TB)‘s takeover of Glow under a revised plan in which they have to: 1) sell Glow SPP1, a power plant with 124MW capacity and 90 tons/hr of steam; and 2) allow clients such as Pa Daeng to change providers. This will reduce Glow’s market share within the MapTaPhut area, but Athaporn Arayasantiparb, CFA thinks the purchase price (Bt139bn according to Bangkok Post) will have to be revised downwards too. For more on the original deal, see Deal Alert! GPSC Goes For the Jugular! and Anti-Trust Should Be A Non-Issue In The GPSC/Glow Deal.
- Unisem (M) (UNI MK). The Offer is now unconditional and will remain open to acceptances until the 7 January 2019.
- Stanmore Coal (SMR AU). The offer has been extended until the 22 January 2019.
CCASS
Often these moves can easily be explained – the placement of new shares, rights issue, movements subsequent to a takeover, amongst others. For those mentioned below, I could not find an obvious reason for the CCASS move.
Name | % change | Into | Out of | Comment |
Putian Communication (1720 HK) | 69.75% | Shanghai Pudong | Outside CCASS | |
37.68% | China Industrial | Outside CCASS | ||
16.23% | HSBC | Outside CCASS |
3. Hotel Properties Ltd– Dissolution of Wheelock-OBS Partnership Could Pave Way for Privatization Offer

Hotel Properties (HPL SP) (“HPL”) announced on Friday evening a significant change in its shareholdings relating to the HPL shares owned by 68 Holdings Pte Ltd.
The restructuring of shareholding did not come as a surprise and was within expectations.
Now, Wheelock holds only a significant minority interest of 22.53% and without a board seat in HPL. Wheelock’s influence in HPL has been reduced significantly. Without control, Wheelock’s investment in HPL is as good as any other non-strategic investment in quoted securities.
In the event that Wheelock Properties decides to sell its HPL shares, Mr Ong will be a likely buyer of the HPL shares. This will present a very good opportunity for Mr Ong to successfully privatise and delist HPL.
4. Prabhat Dairy Ltd – Update: Revenues and Margins Continues to Increase in Line with Our Expectations

Prabhat Dairy Ltd’s quarterly result is in line with our expectation. In Q2 FY19, the company registered a growth of 8.53% YoY, EBITDA margin was 9.4% improving by 119 bps since the same period last year, EBITDA grew by 24.2% YOY; the profit margin was at 2.95% improving by 60 bps YoY, Net Income grew by 35.86% YOY. For more details about the company, please refer to our initiation report Prabhat Dairy Ltd – An Emerging Star in the Indian Milky Way. B2B business contributed to 70% of revenue and the remaining 30% was driven by B2C business. Value Added Products contributed to 25% of revenue in Q2FY19.
The stock is trading at 16.3x its TTM EPS, 13.8x its FY19F EPS. Margins have improved over the past quarters due to lower cost of raw materials, we expect raw materials to continue to be lower than their historic average in short term. Lower cost of raw material along with the improving contribution from B2C will lead to higher margins in medium to long term. The company also wants to increase its B2C contribution aggressively from the current 30% to 50% by 2020.
We will monitor the stock closely to firm up our views further, albeit we remain positive on the long-term prospects of the company.
5. Swaraj Engines: Positive Outlook But Growth Is Slowing and Valuation Is Rich

Swaraj Engines (SWE IN) (SEL)is primarily manufacturing diesel engines for fitment into Swaraj tractors manufactured by Mahindra & Mahindra Ltd. (M&M). The Company is also supplying engine components to SML Isuzu Ltd used in the assembly of commercial vehicle engines. SEL was started as a joint venture between Punjab Tractor Ltd (now acquired by M&M Ltd) and Kirloskar Oil Engines Ltd. M&M holds 33.3% stake in SEL and is its key client.
We are positive about the business because:
- SEL’s growth is correlated with M&M’s tractor business growth. SEL supplies engines to the Swaraj division of M&M. M&M expects tractor growth to be around 12% YoY in FY19E. We forecast SEL’s tractor engine volumes will grow at a CAGR of 12% for FY18-21E.
- The growth of the company is dependent on the monsoon and rural sentiments. We expect the profitability to improve with normal rainfall and government initiatives towards the rural sector. We expect the revenue/ EBITDA/ PAT CAGR for FY18-21E to be 14%/ 15%/ 14% respectively.
- SEL is debt free and a cash generating company. It has a healthy and stable ROCE and ROE. SEL has increased its capacity from 75,000 engines in FY16 to 120,000 engines in FY18. We expect the capacity utilisation to reach 97% by FY20E from 90% in 1HFY19. SEL funds its capex through internal accruals. We forecast a capex of Rs 600 mn for FY19E to FY21E considering the requirement of the additional capacity, R&D and testing costs for new and higher HP engines & for upgradation of engines according to the TREM IV emission norms for >50 HP engines.
We initiate coverage on SEL with a fair value objective of Rs 1,655/- over the next 12 months. This represents a potential upside of 15% from the closing price of Rs 1,435/- (as on 26-12-2018). We arrive at the fair value by applying PE multiple of 18x to EPS of Rs 87/- to the year ending December-20E and add cash of Rs 82/- per share. While the business outlook is good, we think the upside in the share price is limited due to rich valuation.
Particulars (Rs mn) (Y/E March) | FY18 | FY19E | FY20E | FY21E |
Revenue | 7,712 | 9,210 | 10,478 | 11,525 |
PAT | 801 | 906 | 1,063 | 1,190 |
EPS (Rs) | 64.5 | 74.8 | 87.6 | 98.1 |
PE (x) | 22.3 | 19.2 | 16.4 | 14.6 |
Note: E= Estimates